【代码整理】COCO格式数据集画框
发布时间:2024年01月23日
可以用于排查数据集转化后可能出现的坐标错误,类别不对齐等需要可视化才能发现的问题
import部分
from pycocotools.coco import COCO
import numpy as np
import os
from PIL import Image
from matplotlib.collections import PatchCollection
from matplotlib.patches import Polygon
import matplotlib.pyplot as plt
VisCOCOBox
class VisCOCOBox:

    def visCOCOGTBoxPerImg(self, coco, image2color, anns):
        '''可视化COCO数据集下一张图像的所有GTBoxes
            Args:
                :param coco:        COCO数据集实例
                :param image2color: 每个类别的颜色
                :param anns:        当前图像对应的GTBoxes信息

            Retuens:
                None
        '''
        # 获取当前正在使用的坐标轴对象"get current axis"(这里就是图像的坐标轴)
        ax = plt.gca()
        # 关闭plt的坐标轴自动缩放功能:
        # ax.set_autoscale_on(False)
        # polygons存储plt的多边形实例(即bbox), colors存储每个bbox对应的颜色(区分不同的类别)
        polygons, colors = [], []
        for ann in anns:
            color = image2color[ann['category_id']]
            x, y, w, h = ann['bbox']
            # 采用多边形画法:
            poly = [[x, y], [x, y + h], [x + w, y + h], [x + w, y]]
            polygons.append(Polygon(np.array(poly).reshape((4,2))))
            colors.append(color)
            # 可视化每个bbox的类别的文本(ax.text的bbox参数用于调整文本框的样式):
            ax.text(x, y, f"{coco.loadCats(ann['category_id'])[0]['name']}", color='white', bbox=dict(facecolor=color))


        # PatchCollection批量绘制图形, 而不是单独绘制每一个(采用填充,透明度为alpha)
        p = PatchCollection(polygons, facecolor=colors, linewidths=0, alpha=0.4)
        ax.add_collection(p)


    # 批量可视化coco格式数据集的GT
    def visCOCOGTBoxes(self, jsonPath, imgDir, visNum, saveVisDir):
        '''批量可视化数据集GTBoxes(可以用于排查画框等错误)
            Args:
                :param jsonPath:    COCO格式Json文件路径
                :param imgDir:      图像根目录
                :param visNum:      可视化几张图像
                :param saveVisDir:  可视化图像保存目录

            Retuens:
                None
        '''
        if not os.path.isdir(saveVisDir):os.makedirs(saveVisDir)
        # 创建COCO数据集读取实例:
        coco = COCO(jsonPath)
        # 每个类别都获得一个随机颜色:
        image2color = dict()
        for cat in coco.getCatIds():
            image2color[cat] = (np.random.random((1, 3)) * 0.7 + 0.3).tolist()[0]
        # 获取数据集中所有图像对应的imgId:
        imgId = coco.getImgIds()
        # 打乱数据集图像读取顺序:
        np.random.shuffle(imgId)

        for i in range(visNum):
            plt.figure(figsize=(20, 13))
            # 获取图像信息(json文件 "images" 字段)
            imgInfo = coco.loadImgs(imgId[i])[0]
            imgPath = os.path.normpath(os.path.join(imgDir, imgInfo['file_name']))
            # 这里win和linux或许不一样:
            imgName = imgPath.split('\\')[-1]
            # 得到当前图像里包含的BBox的所有id
            annIds = coco.getAnnIds(imgIds=imgInfo['id'])
            # anns (json文件 "annotations" 字段)
            anns = coco.loadAnns(annIds)
            # 读取图像
            image = Image.open(imgPath).convert('RGB')

            plt.imshow(image)
            # 画框:
            self.visCOCOGTBoxPerImg(coco, image2color, anns)
            # 样式:
            plt.xticks([])
            plt.yticks([])
            plt.tight_layout()
            # 保存可视化结果
            plt.savefig(os.path.join(saveVisDir, f'vis_{imgName}'), bbox_inches='tight', pad_inches=0.0, dpi=150)
example
if __name__ == '__main__':
    jsonPath = 'E:/datasets/RemoteSensing/visdrone2019/annotations/train.json'
    imgDir = 'E:/datasets/RemoteSensing/visdrone2019/images/train/images'
    saveVisDir = './vis1'
    COCOVis = VisCOCOBox()
    COCOVis.visCOCOGTBoxes(jsonPath, imgDir, 4, saveVisDir)
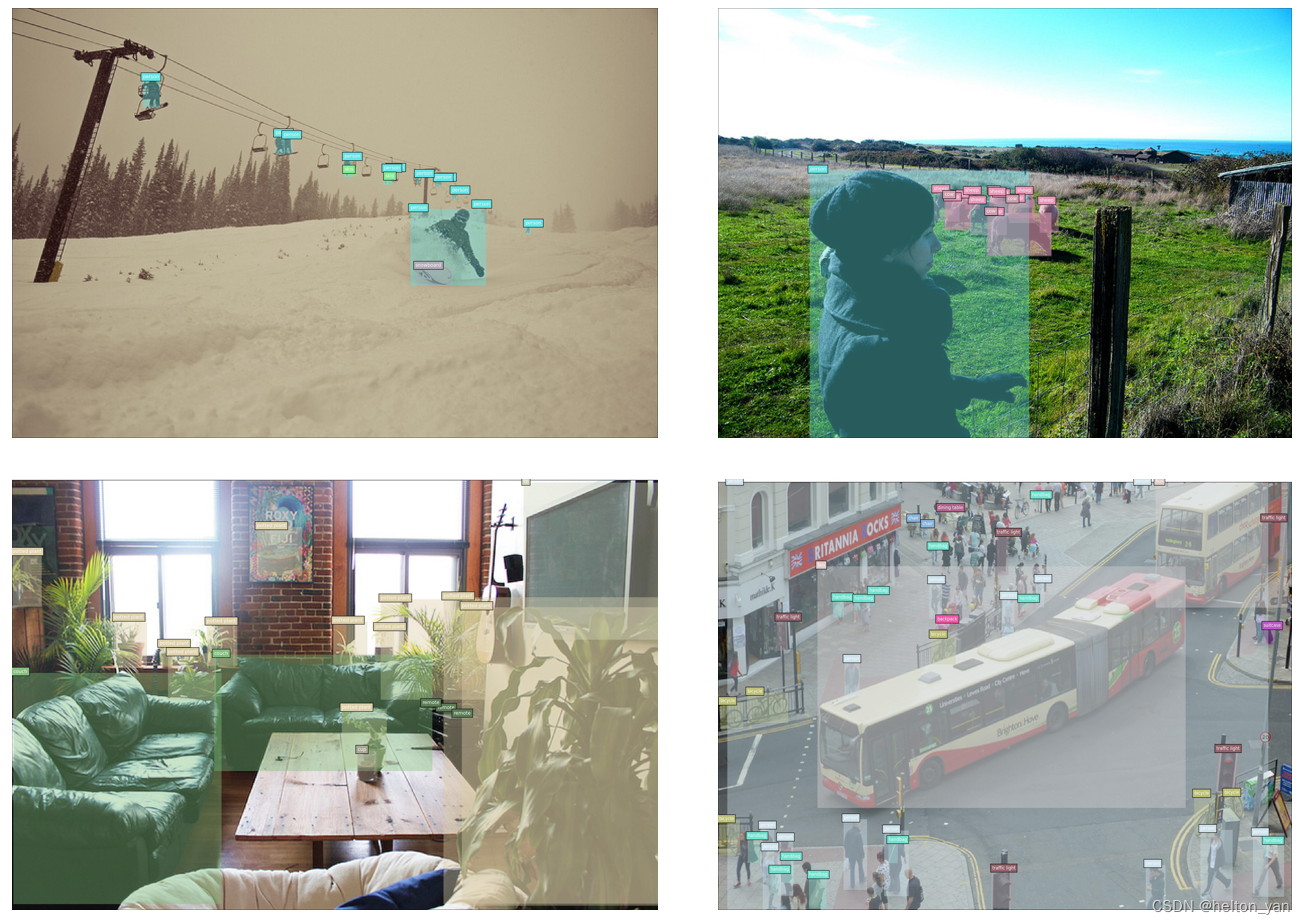
输出(COCO2017数据集train):
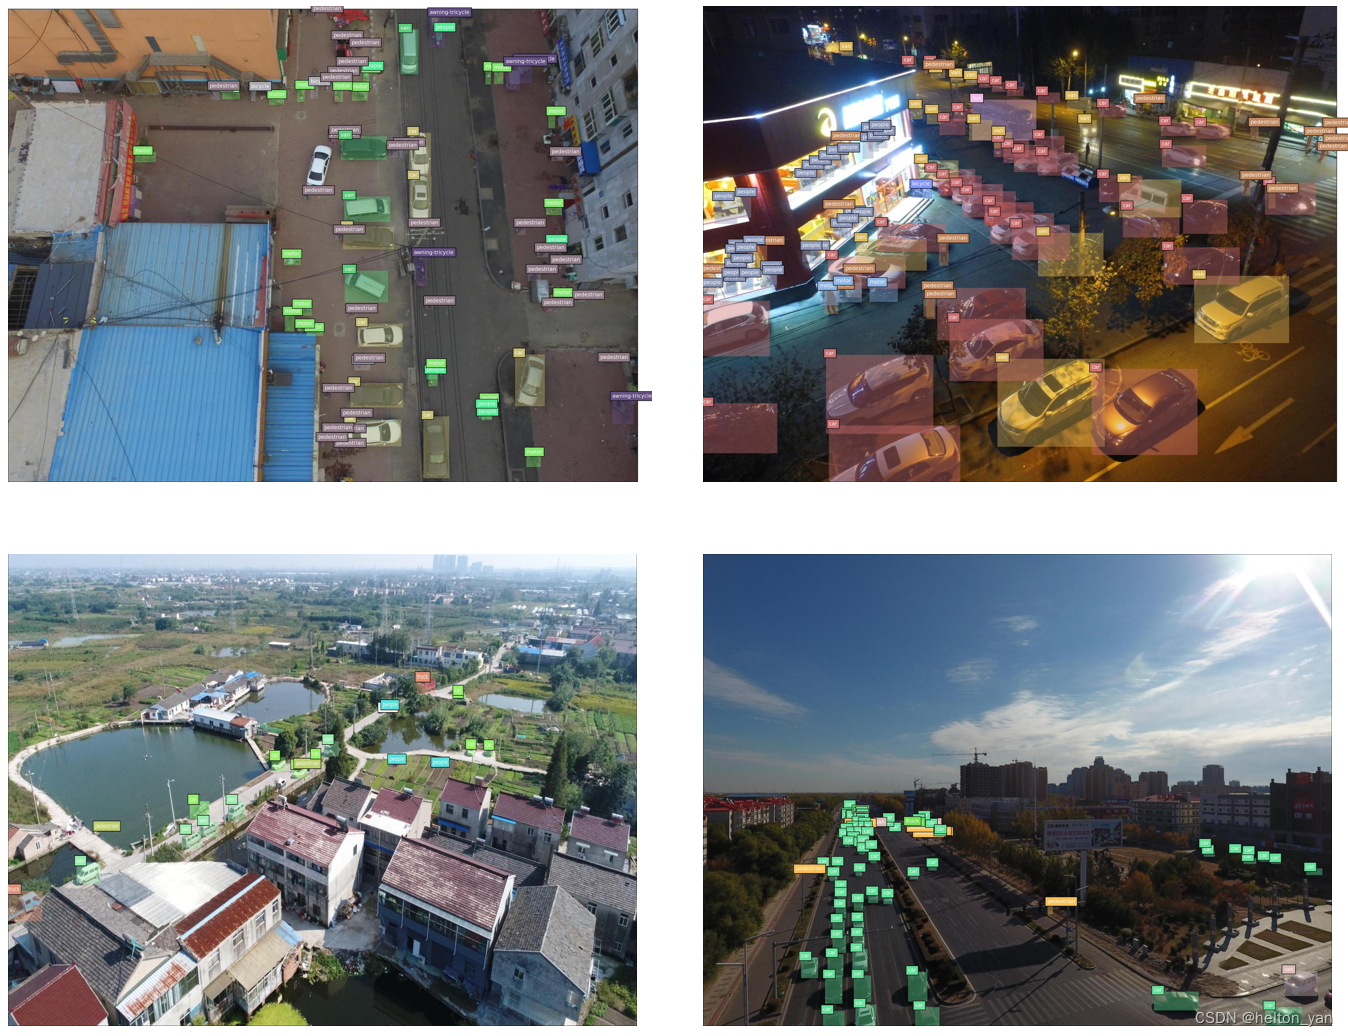
输出(VisDrone2019数据集):
文章来源:https://blog.csdn.net/SESESssss/article/details/135761397
本文来自互联网用户投稿,该文观点仅代表作者本人,不代表本站立场。本站仅提供信息存储空间服务,不拥有所有权,不承担相关法律责任。 如若内容造成侵权/违法违规/事实不符,请联系我的编程经验分享网邮箱:chenni525@qq.com进行投诉反馈,一经查实,立即删除!
本文来自互联网用户投稿,该文观点仅代表作者本人,不代表本站立场。本站仅提供信息存储空间服务,不拥有所有权,不承担相关法律责任。 如若内容造成侵权/违法违规/事实不符,请联系我的编程经验分享网邮箱:chenni525@qq.com进行投诉反馈,一经查实,立即删除!
最新文章
- Python教程
- 深入理解 MySQL 中的 HAVING 关键字和聚合函数
- Qt之QChar编码(1)
- MyBatis入门基础篇
- 用Python脚本实现FFmpeg批量转换
- 『运维心得』你的苹果手机突然没有信号怎么办?
- 2024最新面试经验分享
- CNCF之CoreDNS
- 搜维尔科技:【新闻速递】第九届元宇宙数字人设计大赛校园行宣讲—辽宁科技大学站
- 引用数据类型和基础数据类型的区别
- AR与AI融合加速,医疗护理更便捷
- Mac下载Navicat premium提示文件损坏的解决方案
- java基于Spring Boot+vue的学生宿舍管理系统qkc37
- xtu oj 1351 Palindrome
- 12月,全国各地电子签推广应用政策汇总