【同济子豪兄斯坦福CS224W中文精讲】NetworkX代码学习笔记
安装配置
matplotlib中文字体设置
import networkx as nx
import matplotlib.pyplot as plt
# 魔法指令,设置后在jupyter notebook中绘制的图形会显示在输出单元格中,而不是弹出一个新窗口
%matplotlib inline

# windows操作系统
plt.rcParams['font.sans-serif']=['SimHei']  # 用来正常显示中文标签
plt.rcParams['axes.unicode_minus']=False  # 用来正常显示负号
测试代码
plt.plot([1,2,3], [100,500,300])
plt.title('matplotlib中文字体测试', fontsize=25)
plt.xlabel('X轴', fontsize=15)
plt.ylabel('Y轴', fontsize=15)
plt.show()

创建图
内置图创建
全连接无向图:G = nx.complete_graph(7)
全连接有向图:G = nx.complete_graph(7, nx.DiGraph())
随机图:G = nx.erdos_renyi_graph(10, 0.5)
空手道俱乐部数据集:G = nx.karate_club_graph()

雨果《悲惨世界》人物关系图:G = nx.les_miserables_graph()

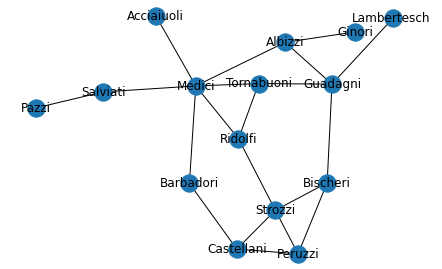
Florentine families graph:G = nx.florentine_families_graph()

G = nx.random_k_out_graph(10, 3, 0.5, seed=seed)
创建一个10个节点,每个节点出度为3的有向图,0.5指每条边的生成概率
G = nx.from_pandas_edgelist(df, 'White', 'Black', edge_attr=True, create_using=nx.MultiDiGraph())
从pandas的DataFrame数据中创建一个有向多重图,利用表中White列和Black列的数据创建有向图,一行数据代表一条边,表中其他列都作为这条边的属性被存储起来。另外如果一条边会对应多行数据,这些数据存储在以0、1、2…为key值的字典中,使用G.get_edge_data(node1, node2)得到
Ego图创建
# 原图创建
n = 1000
m = 2
seed = 20532
G = nx.barabasi_albert_graph(n, m, seed=seed)
# 将原图中degree最大的节点作为ego图的中心
largest_hub, degree = sorted(G.degree(), key=itemgetter(1))[-1]
hub_ego = nx.ego_graph(G, largest_hub, radius=1) # 确定好中心节点
pos = nx.spring_layout(hub_ego, seed=seed)
nx.draw(hub_ego, pos, node_color="b", node_size=50, with_labels=False)
# 单独设置中心节点的图属性
options = {"node_size": 300, "node_color": "r"}
nx.draw_networkx_nodes(hub_ego, pos, nodelist=[largest_hub], **options)
plt.show()
连接表创建图
代码模板
# 导入 csv 文件定义的三元组连接表,构建有向图
df = pd.read_csv('triples.csv')
G = nx.DiGraph()
edges = [edge for edge in zip(df['head'], df['tail'])]
G.add_edges_from(edges) # 根据二元组顶点对列表创建图
# 可视化
pos = nx.spring_layout(G, seed=123) # 为图G的可视化生成布局,spring_layout是一种弹簧模型布局,seed=123设置了随机数种子值,保证了多次运行时得到的布局相同,增加可复现性
plt.figure(figsize=(15,15))
nx.draw(G, pos=pos, with_labels=True) # pos参数设置了节点布局信息
邻接表保存/创建图
# 将图以邻接表形式保存,邻接表形式的数据每行代表一条边,每条边的节点之间使用特定分隔符进行分隔
nx.write_edgelist(G, path="grid.edgelist", delimiter=":") # delimiter设置的是节点之间的分隔符
# 从本地文件 grid.edgelist 读取邻接表
H = nx.read_edgelist(path="grid.edgelist", delimiter=":")
常用图属性
图绘制:nx.draw()
连接数:G.size()
节点展示:G.nodes
节点数:G.number_of_nodes()
展示带属性的节点:G.node(data=True)
无向图连通域分析:nx.connected_components(H)
最大连通子图:Gcc = G.subgraph(sorted(nx.connected_components(G), key=len, reverse=True)[0])
创建节点
G.add_node() 添加单个节点
G.add_nodes_from() 从列表中添加多个节点
添加带属性的节点
方法一:add_nodes_from()参数为节点属性字典二元组列表
方法二:add_node()参数中写明节点属性
# 方法一
G.add_nodes_from([
    ('关羽',{'武器': '青龙偃月刀','武力值':90,'智力值':80}),
    ('张飞',{'武器': '丈八蛇矛','武力值':85,'智力值':75}),
    ('吕布',{'武器':'方天画戟','武力值':100,'智力值':70})
])
# 方法二
G.add_node(0, feature=5, label=0)
创建连接
方法名与创建节点的方法名类似
# 单个连接
G.add_edge(0, 1, weight=0.5, like=3)
# 多个连接
G.add_edges_from([
  (1, 2, {'weight': 0.3, 'like':5}),
  (2, 0, {'weight': 0.1, 'like':8})
])
节点连接数
# 指定节点
node_id = 1
# 指定节点的所有相邻节点
for neighbor in G.neighbors(node_id):
    print("Node {} has neighbor {}".format(node_id, neighbor))
可视化图
使用NetworkX自带的可视化函数
nx.draw,绘制不同风格的图。设置节点尺寸、节点颜色、节点边缘颜色、节点坐标、连接颜色等。
代码模板
nx.draw(
    G,
    pos,                       # 节点坐标(使用某种布局入spring_layout布局得到节点坐标
    node_color='#A0CBE2',      # 节点颜色
    edgecolors='red',          # 节点外边缘的颜色
    edge_color="blue",         # edge的颜色
    node_size=100,             # 节点尺寸
    with_labels=False,
    # arrowsize=10,            # 如果是有向图,设置箭头尺寸
    width=3,
)
看一个设置每个节点坐标以可视化的例子
G = nx.Graph()
G.add_edge(1, 2)
G.add_edge(1, 3)
G.add_edge(1, 5)
G.add_edge(2, 3)
G.add_edge(3, 4)
G.add_edge(4, 5)
# 设置每个节点可视化时的坐标
pos = {1: (0, 0), 2: (-1, 0.3), 3: (2, 0.17), 4: (4, 0.255), 5: (5, 0.03)}

# 设置其它可视化样式
options = {
    "font_size": 36,
    "node_size": 3000,
    "node_color": "white",
    "edgecolors": "black",
    "linewidths": 5, # 节点线宽
    "width": 5, # edge线宽
}

nx.draw_networkx(G, pos, **options)

ax = plt.gca()
ax.margins(0.20) # 在图的边缘留白,防止节点被截断
plt.axis("off")
plt.show()
在看一个单独设置各个节点样式的例子
G = nx.house_graph()
# 设置节点坐标
pos = {0: (0, 0), 1: (1, 0), 2: (0, 1), 3: (1, 1), 4: (0.5, 2.0)}
plt.figure(figsize=(10,8))
# 绘制“墙角”的四个节点
nx.draw_networkx_nodes(G, pos, node_size=3000, nodelist=[0, 1, 2, 3], node_color="tab:blue")
# 绘制“屋顶”节点
nx.draw_networkx_nodes(G, pos, node_size=2000, nodelist=[4], node_color="tab:orange")
# 绘制连接
nx.draw_networkx_edges(G, pos, alpha=0.5, width=6)
plt.axis("off") # 去掉坐标轴
plt.show()
自定义节点图标的处理
# 给每个节点添加各自的图片
for n in G.nodes:
    xf, yf = ax.transData.transform(pos[n]) # data坐标 转 display坐标
    xa, ya = fig.transFigure.inverted().transform((xf, yf)) # display坐标 转 figure坐标

    a = plt.axes([xa - icon_center, ya - icon_center, icon_size, icon_size])
    a.imshow(G.nodes[n]["image"])
    a.axis("off")
处理.gz文件
# 通过gzip库和shutil库解压缩.gz文件展示结构
import gzip
import shutil
input_file = 'knuth_miles.txt.gz'
output_file = 'knuth_miles.txt'

with gzip.open(input_file, 'rb') as f_in, open(output_file, 'wb') as f_out:
    shutil.copyfileobj(f_in, f_out)

# 文件展示
with open('knuth_miles.txt', 'r') as file:
    content = file.read()
    print(content)
按照节点度以可视化模板
# 可视化函数
def draw(G, pos, measures, measure_name):

    nodes = nx.draw_networkx_nodes(G, pos, node_size=250, cmap=plt.cm.plasma,
                                   node_color=list(measures.values()),
                                   nodelist=measures.keys())
    nodes.set_norm(mcolors.SymLogNorm(linthresh=0.01, linscale=1, base=10))
    # labels = nx.draw_networkx_labels(G, pos)
    edges = nx.draw_networkx_edges(G, pos)

    # plt.figure(figsize=(10,8))
    plt.title(measure_name)
    plt.colorbar(nodes)
    plt.axis('off')
    plt.show()

draw(G, pos, dict(G.degree()), 'Node Degree')
图数据挖掘
pagerank算法
计算节点重要度
代码示例
G = nx.star_graph(7)
pagerank = nx.pagerank(G, alpha=0.8)
节点连接数
G.degree() # 得到每个节点的连接数
degree_sequence = sorted((d for n, d in G.degree()), reverse=True)

# 绘制degree rank plot
plt.figure(figsize=(12,8))
plt.plot(degree_sequence, "b-", marker="o")
plt.title('Degree Rank Plot', fontsize=20)
plt.ylabel('Degree', fontsize=25)
plt.xlabel('Rank', fontsize=25)
plt.tick_params(labelsize=20) # 设置坐标文字大小
plt.show()

# degree直方图
X = np.unique(degree_sequence, return_counts=True)[0]
Y = np.unique(degree_sequence, return_counts=True)[1]
plt.figure(figsize=(12,8))
plt.bar(X, Y)
plt.title('Degree Histogram', fontsize=20)
plt.ylabel('Number', fontsize=25)
plt.xlabel('Degree', fontsize=25)
plt.tick_params(labelsize=20) # 设置坐标文字大小
plt.show()
图特征分析
# 半径
nx.radius(G)
# 直径
nx.diameter(G)
# 偏心度:每个节点到图中其它节点的最远距离
nx.eccentricity(G)
# 中心节点,偏心度与半径相等的节点
nx.center(G)
# 外围节点,偏心度与直径相等的节点
nx.periphery(G)
# 图中连接的稠密程度
nx.density(G)
# 最短距离
pathlengths = []
for v in G.nodes():
    spl = nx.single_source_shortest_path_length(G, v)
    for p in spl:
        print('{} --> {} 最短距离 {}'.format(v, p, spl[p]))
        pathlengths.append(spl[p])
# 平均最短距离
sum(pathlengths) / len(pathlengths)
# 不同距离的节点对个数
dist = {}
for p in pathlengths:
    if p in dist:
        dist[p] += 1
    else:
        dist[p] = 1
节点重要度特征
无向图
nx.degree_centrality(G)
nx.eigenvector_centrality(G)
必经之地:nx.betweenness_centrality(G)
去哪都近:nx.closeness_centrality(G)
nx.pagerank(DiG, alpha=0.85)
nx.katz_centrality(G, alpha=0.1, beta=1.0)
有向图
nx.in_degree_centrality(DiG)
nx.out_degree_centrality(DiG)
nx.eigenvector_centrality_numpy(DiG)
社群属性
三角形个数:nx.triangles(G)
聚集系数:nx.clustering(G)
重要的全图特征
桥:nx.bridges(G)
共同的邻居:nx.common_neighbors(G, 0, 4)
katz index计算
import networkx as nx
import numpy as np
from numpy.linalg import inv
G = nx.karate_club_graph()

# 计算主特征向量
L = nx.normalized_laplacian_matrix(G)
e = np.linalg.eigvals(L.A)
print('最大特征值', max(e))

# 折减系数
beta = 1/max(e)

# 创建单位矩阵
I = np.identity(len(G.nodes))

# 计算 Katz Index
S = inv(I - nx.to_numpy_array(G)*beta) - I
两个节点是否连通:nx.has_path(G, source='昌吉东路', target='同济大学')
任意两个节点之间的最短路径:nx.shortest_path(G, source='昌吉东路', target='同济大学', weight='time')
最短路径长度:nx.shortest_path_length(G, source='昌吉东路', target='同济大学', weight='time')
全图平均最短路径长度:nx.average_shortest_path_length(G, weight='time')
graphlet个数计算
import networkx as nx
import matplotlib.pyplot as plt
%matplotlib inline
import itertools

G = nx.karate_club_graph()
target = nx.complete_graph(3)
num = 0
for sub_nodes in itertools.combinations(G.nodes(), len(target.nodes())):  # 遍历全图中,符合graphlet节点个数的所有节点组合
    subg = G.subgraph(sub_nodes)                                          # 从全图中抽取出子图
    if nx.is_connected(subg) and nx.is_isomorphic(subg, target):          # 如果子图是完整连通域,并且符合graphlet特征,输出原图节点编号
        num += 1
        print(subg.edges())
参考资料
- 同济子豪兄课程repo地址:https://github.com/TommyZihao/zihao_course/tree/main/CS224W
本文来自互联网用户投稿,该文观点仅代表作者本人,不代表本站立场。本站仅提供信息存储空间服务,不拥有所有权,不承担相关法律责任。 如若内容造成侵权/违法违规/事实不符,请联系我的编程经验分享网邮箱:chenni525@qq.com进行投诉反馈,一经查实,立即删除!
- Python教程
- 深入理解 MySQL 中的 HAVING 关键字和聚合函数
- Qt之QChar编码(1)
- MyBatis入门基础篇
- 用Python脚本实现FFmpeg批量转换
- 【AI的未来 - AI Agent系列】【MetaGPT】4.1 细说我在ActionNode实战中踩的那些坑
- windows安装sqlserver2008后连接失败问题
- 【已解决】在开启ssh和sshd状态下,XShell无法连接到VMware虚拟机中的Linux操作系统
- GBASE南大通用GBase BI V5的功能特点分享——第一部分
- 信号和槽的一个测试demo--计算球的体积
- linux查看防火墙状态及开启关闭命令
- 国产游泳耳机哪个好?被公认最好的四款国产游泳耳机分享
- 正运动技术荣获2023年度“AI天马”认定
- [VulnHub靶机渗透] The Ether: EvilScience (v1.0.1)
- Windows漏洞利用开发——利用ROP绕过DEP保护