echarts的一些图形配置
发布时间:2023年12月29日
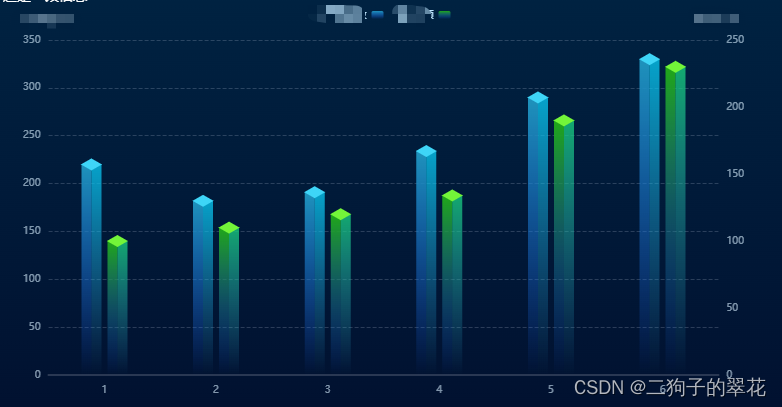
双立体柱状图
示意图:
配置:
initData() {
let sideData = [220, 182, 191, 234, 290, 330]
let sideData1 = [100, 110, 120, 134, 190, 230]
let nameList = ['结算能力数', '结算金额']
let yAxisData = ['(金额/亿元)', '(能力数/个)']
let xData = ['1', '2', '3', '4', '5', '6']
this.initEchartsDom(sideData, sideData1, xData, nameList, yAxisData)
},
/**
*
* @param {*} sideData:蓝色柱状图的数据
* @param {*} sideData1 :绿色柱状图的数据
* @param {*} xData 横坐标数据
* @param {*} nameList :柱状图的名称对应着图例,[蓝色的,绿色的]
* @param {*} yAxisData :yAxis配置,如果length>1,则设置两个纵坐标,并且第二个柱状图yAxisIndex为1
*/
initEchartsDom(sideData, sideData1, xData, nameList, yAxisData) {
const name1 = nameList[0];
const name2 = nameList[1];
let x = xData;
// 通用的yAxis属性
let yAxisCommonSetting = {
nameTextStyle: {
color: "rgba(216,240,255,0.6)",
fontSize: 10
},
type: 'value',
axisLabel: {
formatter: "{value}",
textStyle: {
color: "rgba(216,240,255,0.6)",
fontSize: 10
}
},
}
//根据yAxisData配置yAxis
let yAxis = [{
name: yAxisData[0],
...yAxisCommonSetting,
splitLine: {
show: true, // 是否显示分隔线。默认数值轴显示,类目轴不显示
lineStyle: {
type: 'dashed',
color: 'rgba(208,222,238,0.20)',
width: 1 // 设置分割线的粗细为2
}
}
}]
if (yAxisData.length > 1) {
yAxis.push({
name: yAxisData[1],
...yAxisCommonSetting,
position: "right",
splitLine: {
show: false
},
})
}
let option = {
legend: {
position: "top",
show: true,
align: "right",
itemWidth: 12,
itemHeight: 8,
textStyle: {
color: '#C0E7FF',
fontSize: 10
},
},
grid: {
top: 35,
left: 20,
right: 20,
bottom: 10,
containLabel: true
},
toolbox: {
show: true,
},
calculable: true,
xAxis: [
{
type: 'category',
axisLine: {
show: true,
lineStyle: {
type: 'solid',
color: '#2a3853',
width: 2
}
},
axisTick: {
show: false
},
data: x,
axisLabel: {
color: 'rgba(216,240,255,0.6)',
fontSize: 10,
rotate: 0,
margin: 10,
clickable: true,
formatter: function (value) {
if (value.length > 8) {
// 文本超长后换行
return value.substr(0, 8) + '..'
} else {
return value
}
},
}
}
],
yAxis: yAxis,
series: [
{
name: name1,//左侧
tooltip: {
show: false
},
type: 'bar',
barWidth: 10,
itemStyle: {
normal: {
color: new echarts.graphic.LinearGradient(0, 1, 0, 0, [{
offset: 0,
color: "rgba(26,102,255,0)" // 0% 处的颜色
}, {
offset: 1,
color: "rgba(30,147,188,1)", // 100% 处的颜色
}], false)
}
},
data: sideData,
barGap: 0,
},
{
name: name1,
type: 'bar',
barWidth: 10,
itemStyle: {
normal: {
color: new echarts.graphic.LinearGradient(0, 1, 0, 0, [{
offset: 0,
color: "rgba(51,173,234,0)" // 0% 处的颜色
}, {
offset: 1,
color: "rgba(7,195,237,0.8)", // 100% 处的颜色
}], false)
}
},
barGap: 0,
data: sideData,
label: {
show: false,
position: 'top',
textStyle: {
color: 'white',
fontSize: 10
}
}
}, {
data: sideData,
type: "pictorialBar",
barMaxWidth: "20",
symbolPosition: "end",
symbol: "diamond",
symbolOffset: ['-13', "-6"],
symbolSize: [21, 12],
zlevel: 2,
itemStyle: {
color: '#3ed5f7' // 顶部方块的颜色
},
},
// 中间跟背景颜色一样的一个柱子,将两个立体柱子分开
{
name: name1,
type: 'bar',
barWidth: 6,
tooltip: {
show: false
},
itemStyle: {
normal: {
color: new echarts.graphic.LinearGradient(0, 1, 0, 0, [{
offset: 0,
color: "rgba(0,30,61, 0)" // 0% 处的颜色
}, {
offset: 1,
color: "rgba(0,30,61, 0)", // 100% 处的颜色
//opacity:0.5
}], false)
}
},
barGap: 0,
data: sideData,
label: {
show: false,
position: 'top',
textStyle: {
color: 'white',
fontSize: 10
}
}
},
// 第二个柱状图
{
name: name2,
yAxisIndex: 1,
tooltip: {
show: false
},
type: 'bar',
barWidth: 10,
itemStyle: {
normal: {
color: new echarts.graphic.LinearGradient(0, 1, 0, 0, [{
offset: 0,
color: "rgba(26,102,255,0)" // 0% 处的颜色
}, {
offset: 1,
color: "rgba(32,167,24,1)", // 100% 处的颜色
}], false)
}
},
data: sideData1,
barGap: 0,
},
{
name: name2,
type: 'bar',
barWidth: 10,
yAxisIndex: 1,
itemStyle: {
normal: {
color: new echarts.graphic.LinearGradient(0, 1, 0, 0, [{
offset: 0,
color: "rgba(51,173,234,0)" // 0% 处的颜色
}, {
offset: 1,
color: "rgba(24,203,125,0.8)", // 100% 处的颜色
}], false)
}
},
barGap: 0,
data: sideData1,
label: {
show: false,
position: 'top',
textStyle: {
color: 'white',
fontSize: 10
}
}
},
// 顶部方块
{
data: sideData1,
type: "pictorialBar",
barMaxWidth: "20",
yAxisIndex: 1,
symbolPosition: "end",
symbol: "diamond",
symbolOffset: ['13', "-6"],
symbolSize: [21, 12],
zlevel: 2,
itemStyle: {
color: '#73F539' // 顶部方块的颜色
},
},
]
};
this.initEchart(this.$refs.echartsDom, option, 'echartsDom');
},
// 初始化图表
initEchart(ref, option, name) {
const myChart = echarts.init(ref);
myChart.setOption(option, true);
this[name] = myChart;
}
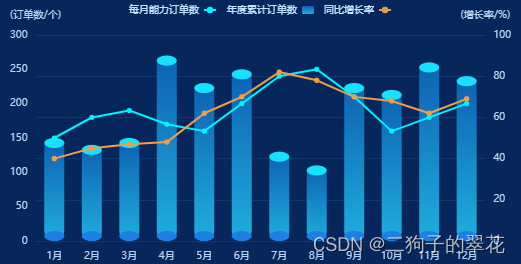
立体圆柱形柱状图及折线图
示意图:
配置:
// 左侧的图
    initOrderingTrend() {
      let xAxisData = ['1月', '2月', '3月', '4月', '5月', '6月', '7月', '8月', '9月', '10月', '11月', '12月']
      let seriesData = [150, 140, 150, 270, 230, 250, 130, 110, 230, 220, 260, 240]
      let seriesData1 = [150, 180, 190, 170, 160, 200, 240, 250, 210, 160, 180, 200]
      let seriesData2 = [40, 45, 47, 48, 62, 70, 82, 78, 70, 68, 62, 69]
      let seriesName = ['每月能力订单数', '年度累计订单数', '同比增长率']//折线图名称,柱状图名称,橘色折线图名称
      let yAxisName = ['(订单数/个)', '(增长率/%)']//两侧纵坐标的名称


      let option = this.getBarOption(xAxisData, seriesData, seriesData1, seriesData2, seriesName, yAxisName);
      this.initEchart(this.$refs.orderingTrend, option, 'orderingTrend');
    },


    //获取圆柱形柱状图option
    getBarOption(xAxisData, seriesData, seriesData1, seriesData2, seriesName, yAxisName) {
      return {
        xAxis: {
          type: 'category',
          data: xAxisData,
          axisLine: {
            show: false
          },
          axisTick: {
            show: false
          },
          triggerEvent: true,
          axisLabel: {
            color: '#B8D3F1',
            fontSize: 10,
            rotate: 0,
            margin: 10,
            clickable: true,
            formatter: function (value) {
              if (value.length > 8) {
                // 文本超长后换行
                return value.substr(0, 8) + '..'
              } else {
                return value
              }
            },
          }
        },

        grid: {
          top: 35,
          left: 20,
          right: 20,
          bottom: 10,
          containLabel: true
        },
        legend: {
          show: true,
          align: "right",
          itemWidth: 12,
          itemHeight: 8,
          textStyle: {
            color: '#C0E7FF',
            fontSize: 10
          },
        },
        yAxis: [
          {
            type: "value",
            name: yAxisName[0],
            min: 0,
            position: "left",

            axisLabel: {
              formatter: "{value}",
              textStyle: {
                color: "#B8D3F1",
                fontSize: 10
              }
            },
            nameTextStyle: {
              color: "#B8D3F1",
              fontSize: 10,
            },
            // max: maxY,
            axisTick: {
              show: false,
            },
            splitLine: {
              show: false,
            },
          },
          {
            type: "value",
            max: 100,
            name: yAxisName[1],
            min: 0,
            nameTextStyle: {
              color: "#B8D3F1",
              fontSize: 10
            },
            axisTick: {
              show: false,
            },
            position: "right",
            axisLabel: {
              formatter: "{value}",
              textStyle: {
                color: "#B8D3F1",
                fontSize: 10

              }
            },
            splitLine: {
              show: true,    // 是否显示分隔线。默认数值轴显示,类目轴不显示
              lineStyle: {
                type: 'solid',
                color: 'rgba(87,206,234,0.1)',
                width: 1 // 设置分割线的粗细为2
              }
            }
          },
        ],


        tooltip: {
          trigger: 'axis',
          renderMode: "html",
          appendToBody: true,
          className: 'custom-tooltip',

          axisPointer: {
            // Use axis to trigger tooltip
            type: 'shadow' // 'shadow' as default; can also be 'line' or 'shadow'
          },
          formatter: function (params) {
            var relVal = '';
            for (var i = 0, l = params.length; i < l; i++) {
              if (!params[i].seriesName.includes('series')) relVal += params[i].marker + params[i].seriesName + "  " + params[i].value + '<br/>'
            }
            return relVal
          }

        },

        series: [
          // 折线图1
          {
            name: seriesName[0],
            type: "line",
            symbolSize: 5,
            symbol: "circle",
            itemStyle: {
              color: "#00F6FF",
            },
            data: seriesData1
          },
          // 圆形柱状图
          {
            name: seriesName[1],
            data: seriesData,
            type: 'bar',
            barWidth: 20,
            // 柱形颜色渐变
            color: {
              type: 'linear',
              x: 0,
              y: 0,
              x2: 0,
              y2: 1,
              colorStops: [
                {
                  offset: 0,
                  color: '#0E60B2'
                },

                {
                  offset: 1,
                  color: '#1FAEDE'
                }
              ],
              global: false
            },
            itemStyle: {
              normal: {
                barBorderRadius: 10,
                label: {
                  show: false,
                  position: 'top',
                  textStyle: {
                    color: '#FFFFFF',
                    fontSize: 12
                  },
                  formatter: function (params) {
                    return params.value
                  }
                }
              }
            }
          },
          {
            color: '#17E1FF',
            type: 'pictorialBar',
            symbol: 'circle',
            symbolSize: ['20', '10'],
            symbolPosition: 'end',
            symbolOffset: [0, 0],
            data: seriesData,
            z: 3,
          }, {
            color: '#1E80E4',
            type: 'pictorialBar',
            symbol: 'circle',
            symbolSize: ['20', '10'],
            symbolPosition: 'start', // 图形边缘与柱子结束的地方内切。
            symbolOffset: [0, 0], // 椭圆水平偏移,垂直偏移. 因为不一定正好盖住柱形,所以可能要移动一点点
            data: seriesData, // 数据要跟主体柱形一致
            z: 3, // 数值越大,层级越高,可以盖住下面的图形
          },


          // 折线图2

          {
            name: seriesName[2],
            type: "line",
            symbolSize: 5,
            yAxisIndex: 1,
            symbol: "circle",
            itemStyle: {
              color: "#EC9C45",
            },
            data: seriesData2
          },
        ]
      };
    },
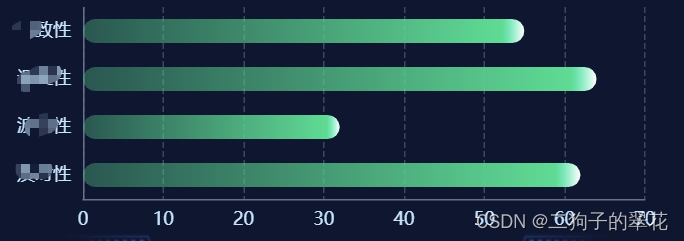
渐变柱状图
示意图:
配置:
 const echartDom = document.getElementById("dataQuality")
      const myChart = echarts.init(echartDom)
      let option = {
        grid: {
          left: "0%",
          top: "0%",
          right: "2%",
          bottom: "0%",
          containLabel: true,
        },
        xAxis: {
          type: "value",
          show: true,
          position: "bottom",
          axisTick: {
            show: false,
          },
          axisLine: {
            show: true,
            lineStyle: {
              color: "#64718a",
            },
          },
          axisLabel: {
            color: "#C0E7FF",
          },
          splitLine: {
            show: true,
            lineStyle: {
              type: "dashed",
              color: "#3a4761"
            }
          },
        },
        yAxis: [
          {
            type: "category",
            axisTick: {
              show: false,
              alignWithLabel: false,
              length: 5,
            },
            splitLine: {
              //网格线
              show: false,
            },
            axisLabel: {
              color: "#C0E7FF",
            },
            inverse: "false",
            axisLine: {
              show: true,
              lineStyle: {
                color: "#64718a",
              },
            },
            data: ["一致性", "调整性", "波动性", "及时性"],
          },
        ],
        series: [
          {
            name: "",
            type: "bar",
            itemStyle: {
              normal: {
                barBorderRadius: 30,
                // color: new echarts.graphic.LinearGradient(
                //   0, 0, 0, 1, [{
                //     offset: 0,
                //     color: "rgba(0, 219, 150, 0.33)",
                //   },
                //   {
                //     offset: 0.95,
                //     color: "rgba(0, 219, 150, 1)",
                //   },
                //   {
                //     offset: 1,
                //     color: "#fff",
                //   }
                // ]
                // ),

                color: {
                  colorStops: [
                    {
                      offset: 0,
                      color: "rgba(0, 219, 150, 0.33)",
                    },
                    {
                      offset: 0.95,
                      color: "rgba(0, 219, 150, 1)",
                    },
                    {
                      offset: 1,
                      color: "#fff",//最后尖尖的白色
                    }
                  ]
                }

              },
              barBorderRadius: 70,
              borderWidth: 0,
              borderColor: "#333",
            },
            barGap: "0%",
            barCategoryGap: "50%",
            data: [55, 64, 32, 62],
          },
        ],
      };

      option && myChart.setOption(option)

      //随着屏幕大小调节图表
      window.addEventListener("resize", () => {
        myChart.resize();
      });
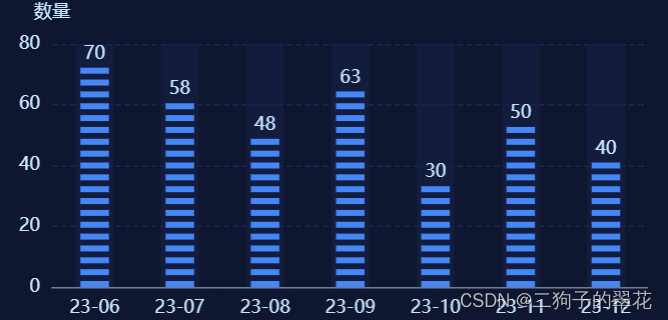
类似电池的柱状图进度条
示意图:
配置:
 // 敏感数据分布(驻)和数据访问量统计公用
    initCommon(idName, xData, yData, maxY) {
      const echartDom = document.getElementById(idName)
      const myChart = echarts.init(echartDom)
      let option = {
        tooltip: {
          trigger: "axis",
          axisPointer: {
            type: "shadow",
          },
          formatter: function (item) {
            return (
              item[0].axisValueLabel +
              "<br />" +
              item[0].seriesName +
              ": " +
              item[0].data
            );
          },
        },
        grid: {
          top: 30,
          right: 0,
          left: 30,
          bottom: 20,
        },
        xAxis: [
          {
            data: xData,
            axisLine: {
              lineStyle: {
                color: "#687c99",
              },
            },
            axisTick: {
              show: false,
            },
            axisLabel: {
              color: "#C0E7FF",
              fontSize: 12,
              interval: 0,
            },
          }
        ],
        yAxis: [
          {
            name: "数量",
            nameTextStyle: {
              color: "#C0E7FF"
            },
            max: maxY,
            axisTick: {
              show: false,
            },
            splitLine: {
              show: true,
              lineStyle: {
                type: "dashed",
                color: "#182450"
              }
            },
            axisLabel: {
              textStyle: {
                color: "#C0E7FF",
              },

            },
          },
        ],
        series: [
          {
            name: "",
            type: "bar",
            barWidth: 25,
            itemStyle: {
              color: "rgba(16, 32, 68,0.6)",
              borderWidth: 0,
              borderColor: "#10bffc",
              padding: 0,
            },
            label: {
              show: false,
            },
            z: 10,
            data: new Array(yData.length).fill(maxY),
          },
          {
            name: "数量",
            type: "pictorialBar",
            symbol: "rect",
            itemStyle: {
              color: "rgba(0, 133, 247, 1)",
            },
            symbolRepeat: true,
            symbolSize: [19, 4],
            symbolMargin: 2,
            symbolPosition: "start",
            z: 20,
            data: yData,

            label: {
              normal: {
                show: true,
                position: "top",
                distance: '15',
                verticalAlign: "top",
                color: "rgba(192, 231, 255, 1)"
              },
            },
          }
        ],
      }


      option && myChart.setOption(option)

      //随着屏幕大小调节图表
      window.addEventListener("resize", () => {
        myChart.resize();
      });

    },
渐变折线图
效果图:

配置:
 const echartDom = document.getElementById("projectOperation")
      const myChart = echarts.init(echartDom)

      let color = ["#0090FF", "#36CE9E", "#FFC005", "#FF515A", "#8B5CFF", "#00CA69"];
      let echartData = [
        {
          name: "23-06",
          value2: 43,
        },
        {
          name: "23-07",
          value2: 20,
        },
        {
          name: "23-08",
          value2: 60,
        },
        {
          name: "23-09",
          value2: 40,
        },
        {
          name: "23-10",
          value2: 17,
        },
        {
          name: "23-11",
          value2: 72,
        },
        {
          name: "23-12",
          value2: 45,
        }
      ];

      let xAxisData = echartData.map((v) => v.name);
      let yAxisData2 = echartData.map((v) => v.value2);
      const hexToRgba = (hex, opacity) => {
        let rgbaColor = "";
        let reg = /^#[\da-f]{6}$/i;
        if (reg.test(hex)) {
          rgbaColor = `rgba(${parseInt("0x" + hex.slice(1, 3))},${parseInt(
            "0x" + hex.slice(3, 5)
          )},${parseInt("0x" + hex.slice(5, 7))},${opacity})`;
        }
        return rgbaColor;
      };

      let option = {
        color: color,
        tooltip: { trigger: "axis" },
        grid: {
          top: 30,
          left: '7%',
          bottom: 20
        },
        xAxis: [
          {
            type: "category",
            boundaryGap: false,
            axisLabel: {
              formatter: "{value}",
              textStyle: {
                color: "rgba(192, 231, 255, 1)",
              },
            },
            splitLine: {
              show: false,
            },
            axisLine: {
              lineStyle: {
                color: "#34405a",
              },
            },
            data: xAxisData,
            axisTick: {
              show: false,
            },
          },
        ],
        yAxis: [
          {

            type: "value",
            name: "访问量(万次)",
            max: 80,
            min: 0,
            splitNumber: 5,
            nameTextStyle: {
              color: "#C0E7FF",
              show: true,
              fontSize: '12',
              align: 'left'
            },
            axisLabel: {
              textStyle: {
                color: "rgba(192, 231, 255, 1)",
              },
            },
            splitLine: {
              lineStyle: {
                type: "dashed",
                color: "#3a4761",
              },
            },
            axisLine: {
              lineStyle: {
                color: "#34405a",
              },
            },
            axisTick: {
              show: false,
            },
          },
        ],
        series: [
          {
            name: "",
            type: "line",
            smooth: true,
            // showSymbol: false,
            symbolSize: 8,
            zlevel: 3,
            lineStyle: {
              normal: {
                color: color[1],
                // shadowBlur: 3,
                // shadowColor: hexToRgba(color[1], 0.5),
                // shadowOffsetY: 8,
              },
            },
            itemStyle: {
              color: "rgba(0, 219, 150, 1)",
              borderColor: "rgba(192, 231, 255, 1)",
              borderWidth: 0,
              // shadowColor: "rgba(0, 0, 0, .3)",
              // shadowBlur: 0,
              // shadowOffsetY: 0,
              // shadowOffsetX: 0,
            },
            areaStyle: {
              normal: {
                color: new echarts.graphic.LinearGradient(
                  0,
                  0,
                  0,
                  1,
                  [
                    {
                      offset: 0,
                      color: hexToRgba(color[1], 0.3),
                    },
                    {
                      offset: 1,
                      color: hexToRgba(color[1], 0.1),
                    },
                  ],
                  false
                ),
                shadowColor: hexToRgba(color[1], 0.1),
                shadowBlur: 0,
              },
            },
            data: yAxisData2,
          },
        ],
      };


      option && myChart.setOption(option)

      //随着屏幕大小调节图表
      window.addEventListener("resize", () => {
        myChart.resize();
      });
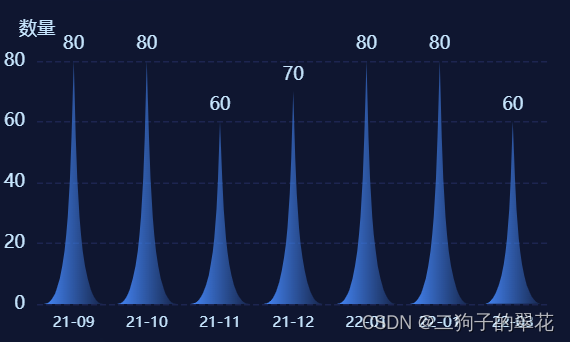
似三角锥(三角形)图形
效果图:
配置:
initDataEcharyts() {
      const echartDom = document.getElementById("dataEcharts")
      const myChart = echarts.init(echartDom)
      let option = {
        grid: {
          top: 30,
          bottom: 20
        },
        xAxis: [
          {
            data: [
              "21-09",
              "21-10",
              "21-11",
              "21-12",
              "22-01",
              "22-01",
              "22-03"
            ],
            axisLabel: {
              color: "#C0E7FF",
              fontSize: 10
            },
            axisTick: {
              show: false
            },
            axisLine: {
              show: false
            }
          }
        ],
        yAxis: [
          {
            name: "数量",
            nameTextStyle: {
              color: "#C0E7FF"
            },
            splitLine: {
              show: true,
              lineStyle: {
                type: "dashed",
                color: "#182450"
              }
            },
            axisLabel: {
              color: "#C0E7FF"
            }
          }
        ],
        // 使用内部缩放(滚轮缩放、鼠标拖着左右滑动)
        dataZoom: [
          {
            type: "inside",
            minValueSpan: 6, // 最小展示数
            start: 0, // 开始展示位置(默认)
            end: 5 // 结束展示位置 (默认)
          }
        ],
        series: [
          {
            name: "hill",
            // 象柱形图
            type: "pictorialBar",
            // 同一系列的柱间距离
            barCategoryGap: "20%",
            // 自定义svg 图标 (三角锥形的关键)
            // symbol: "path://M0,10 L10,10 C5.5,10 5.5,5 5,0 C4.5,5 4.5,10 0,10 z",
            symbol: "path://M0,10 L10,10 C5.5,10 5.5,5 5,2 C4.5,5 4.5,10 0,10 z",
            label: {
              normal: {
                show: true,
                position: "top",
                formatter: "{c}",
                textStyle: {
                  color: "#C0E7FF", //color of value
                },
              },
            },
            // 默认样式
            itemStyle: {
              label: {
                show: false
              },
              borderColor: "#206fde",
              borderWidth: 0,
              color: {
                colorStops: [
                  {
                    offset: 0,
                    color: "rgba(0, 133, 247, 1)"
                  },
                  {
                    offset: 1,
                    color: "rgba(0, 133, 247, 0.14)"
                  }
                ]
              }
            },

            // 鼠标滑过样式
            emphasis: {
              label: {
                show: true,
                position: "top",
                color: "#12DCFF"
              },
              itemStyle: {
                borderColor: "#17cdfa",
                borderWidth: 2,
                color: {
                  colorStops: [
                    {
                      offset: 0,
                      color: "rgba(0, 133, 247, 1)"
                    },
                    {
                      offset: 1,
                      color: "rgba(0, 133, 247, 1)"
                    }
                  ]
                }
              }
            },
            data: [80, 80, 60, 70, 80, 80, 60],
            z: 10
          }
        ]
      }

      option && myChart.setOption(option)

      //随着屏幕大小调节图表
      window.addEventListener("resize", () => {
        myChart.resize();
      });


    },
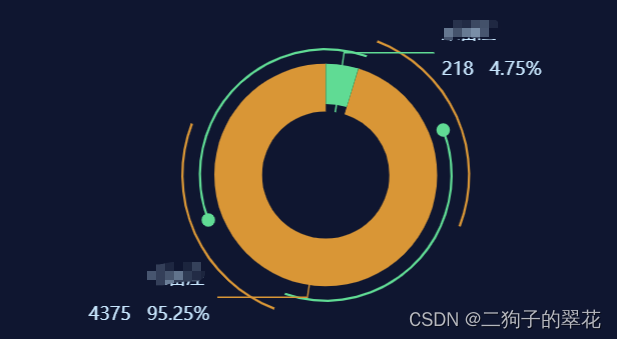
带动画的饼图
外面的环会旋转。
示意图:
配置:
 initCompleteStatistics() {
      const echartDom = document.getElementById("completeStatistics")
      const myChart = echarts.init(echartDom)

      let colorList = ["#00DB96", "#E59734", "#E59734"]
      let angle = 0;
      //获取圆上面某点的坐标(x0,y0表示坐标,r半径,angle角度)
      function getCirlPoint(x0, y0, r, angle) {
        let x1 = x0 + r * Math.cos((angle * Math.PI) / 180);
        let y1 = y0 + r * Math.sin((angle * Math.PI) / 180);
        return {
          x: x1,
          y: y1,
        };
      }

      let option = {
        tooltip: {
          trigger: 'item'
        },
        series: [
          {
            name: '',
            type: 'pie',
            label: {
              position: "outside",
              normal: {
                distance: '30',
                formatter: (a) => {
                  const { value, name, percent } = a
                  return `${name} \n \n${value}   ${percent}%`
                },
                backgroundColor: "rgba(255, 147, 38, 0)",
                borderColor: "transparent",
                borderRadius: 4,
                textStyle: {
                  color: "#C0E7FF",
                  fontSize: 12,
                },
              },
            },

            labelLine: {
              normal: {
                length: 40,
                length2: 60,
                show: true,
                color: "#4e5b75",
              }
            },
            radius: ['70%', '40%'],
            axisLabel: {
              color: "#C0E7FF",
            },
            itemStyle: {
              color: (params) => {
                return colorList[params.dataIndex % colorList.length];
              },
            },
            data: [
              { value: 218, name: '未备注' },
              { value: 4375, name: '已备注' }
            ],
            emphasis: {
              itemStyle: {
                shadowBlur: 10,
                shadowOffsetX: 0,
                shadowColor: 'rgba(0, 0, 0, 0.5)'
              }
            }
          },


          // 外面转圈的环
          {
            name: "ring5",
            type: "custom",
            coordinateSystem: "none",
            renderItem: function (params, api) {
              return {
                type: "arc",
                shape: {
                  cx: api.getWidth() / 2,
                  cy: api.getHeight() / 2,
                  r: (Math.min(api.getWidth(), api.getHeight()) / 2) * 0.9,
                  startAngle: ((0 + angle) * Math.PI) / 180,
                  endAngle: ((90 + angle) * Math.PI) / 180,
                },
                style: {
                  stroke: "#e59734",
                  fill: "transparent",
                  lineWidth: 1.5,
                },
                silent: true,
              };
            },
            data: [0],
          },
          {
            name: "ring5",
            type: "custom",
            coordinateSystem: "none",
            renderItem: function (params, api) {
              return {
                type: "arc",
                shape: {
                  cx: api.getWidth() / 2,
                  cy: api.getHeight() / 2,
                  r: (Math.min(api.getWidth(), api.getHeight()) / 2) * 0.9,
                  startAngle: ((180 + angle) * Math.PI) / 180,
                  endAngle: ((270 + angle) * Math.PI) / 180,
                },
                style: {
                  stroke: "#e59734",
                  fill: "transparent",
                  lineWidth: 1.5,
                },
                silent: true,
              };
            },
            data: [0],
          },
          {
            name: "ring5",
            type: "custom",
            coordinateSystem: "none",
            renderItem: function (params, api) {
              return {
                type: "arc",
                shape: {
                  cx: api.getWidth() / 2,
                  cy: api.getHeight() / 2,
                  r: (Math.min(api.getWidth(), api.getHeight()) / 2) * 0.79,
                  startAngle: ((270 + -angle) * Math.PI) / 180,
                  endAngle: ((40 + -angle) * Math.PI) / 180,
                },
                style: {
                  stroke: "#00db96",
                  fill: "transparent",
                  lineWidth: 1.5,
                },
                silent: true,
              };
            },
            data: [0],
          },
          {
            name: "ring5",
            type: "custom",
            coordinateSystem: "none",
            renderItem: function (params, api) {
              return {
                type: "arc",
                shape: {
                  cx: api.getWidth() / 2,
                  cy: api.getHeight() / 2,
                  r: (Math.min(api.getWidth(), api.getHeight()) / 2) * 0.79,
                  startAngle: ((90 + -angle) * Math.PI) / 180,
                  endAngle: ((220 + -angle) * Math.PI) / 180,
                },
                style: {
                  stroke: "#00db96",
                  fill: "transparent",
                  lineWidth: 1.5,
                },
                silent: true,
              };
            },
            data: [0],
          },
          {
            name: "ring5",
            type: "custom",
            coordinateSystem: "none",
            renderItem: function (params, api) {
              let x0 = api.getWidth() / 2;
              let y0 = api.getHeight() / 2;
              let r = (Math.min(api.getWidth(), api.getHeight()) / 2) * 0.79;
              let point = getCirlPoint(x0, y0, r, 90 + -angle);
              return {
                type: "circle",
                shape: {
                  cx: point.x,
                  cy: point.y,
                  r: 4,
                },
                style: {
                  stroke: "#00db96", //粉
                  fill: "#00db96",
                },
                silent: true,
              };
            },
            data: [0],
          },
          {
            name: "ring5", //绿点
            type: "custom",
            coordinateSystem: "none",
            renderItem: function (params, api) {
              let x0 = api.getWidth() / 2;
              let y0 = api.getHeight() / 2;
              let r = (Math.min(api.getWidth(), api.getHeight()) / 2) * 0.79;
              let point = getCirlPoint(x0, y0, r, 270 + -angle);
              return {
                type: "circle",
                shape: {
                  cx: point.x,
                  cy: point.y,
                  r: 4,
                },
                style: {
                  stroke: "#00db96", //绿
                  fill: "#00db96",
                },
                silent: true,
              };
            },
            data: [0],
          },
        ]
      };


      option && myChart.setOption(option)

      //随着屏幕大小调节图表
      window.addEventListener("resize", () => {
        myChart.resize();

      });

      let that = this
      function draw() {
        let now = new Date().getTime()
        if (now - that.lastTime > 40) {
          angle = angle + 3;
          that.lastTime = now
        }
                myChart.setOption(option, true);
        // window.requestAnimationFrame(draw);
        that.annimationId = requestAnimationFrame(draw)
      }
      setTimeout(() => {
        draw()
      }, 1000);
    },
文章来源:https://blog.csdn.net/Pure_White520/article/details/135288781
本文来自互联网用户投稿,该文观点仅代表作者本人,不代表本站立场。本站仅提供信息存储空间服务,不拥有所有权,不承担相关法律责任。 如若内容造成侵权/违法违规/事实不符,请联系我的编程经验分享网邮箱:chenni525@qq.com进行投诉反馈,一经查实,立即删除!
本文来自互联网用户投稿,该文观点仅代表作者本人,不代表本站立场。本站仅提供信息存储空间服务,不拥有所有权,不承担相关法律责任。 如若内容造成侵权/违法违规/事实不符,请联系我的编程经验分享网邮箱:chenni525@qq.com进行投诉反馈,一经查实,立即删除!
最新文章
- Python教程
- 深入理解 MySQL 中的 HAVING 关键字和聚合函数
- Qt之QChar编码(1)
- MyBatis入门基础篇
- 用Python脚本实现FFmpeg批量转换
- C# —— 接口
- 15、ble_mesh_sensor_model 客户端 传感器
- 【MyBatis-Plus】分页查询
- leetcode算法题之floodfill算法---深搜(dfs)
- SOLIDWORKS插件SolidKits.BOMs工具之属性修改
- Python 从入门到精通之通俗易懂学闭包
- 权威测评首家通过!亚信安慧AntDB通过中国信通院数据库迁移工具专项测试
- JVM主要的几种垃圾回收算法
- 佛洛依德算法详解
- Python学习之路——数据容器部分【字典(dict)】