CEC2013(python):六种算法(RFO、PSO、CSO、WOA、DBO、ABC)求解CEC2013
发布时间:2023年12月25日
一、六种算法简介
1、红狐优化算法RFO
2、粒子群优化算法PSO
3、鸡群优化算法CSO
4、鲸鱼优化算法WOA
5、蜣螂优化算法DBO
6、人工蜂群算法 (Artificial Bee Colony Algorithm, ABC)
二、6种算法求解CEC2013
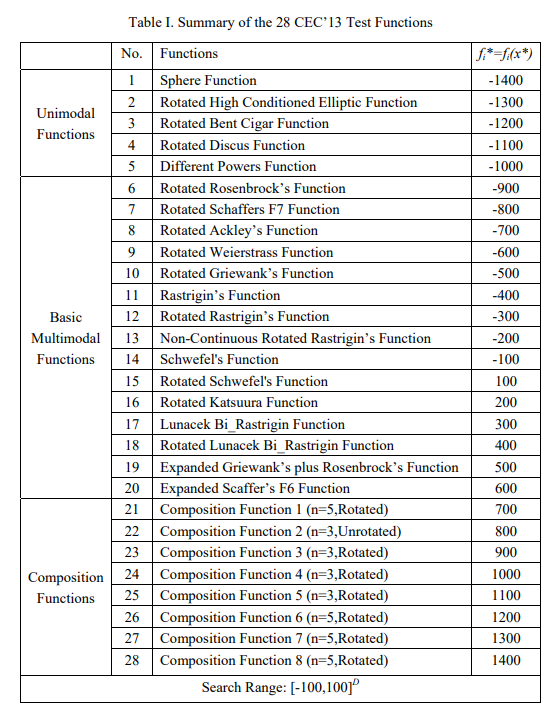
(1)CEC2013简介
参考文献:
[1] Liang J J ,?Qu B Y ,?Suganthan P N , et al. Problem Definitions and Evaluation Criteria for the CEC 2013 Special Session on Real-Parameter Optimization.?2013.
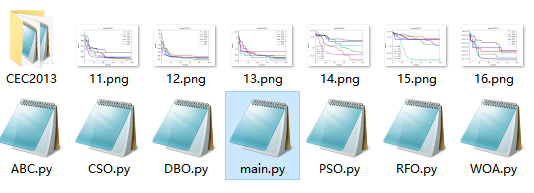
(2)部分python代码
from CEC2013.cec2013 import *
import numpy as np
from RFO import RFO
from ABC import ABC
from PSO import PSO
from WOA import WOA
from CSO import CSO
from DBO import DBO
import matplotlib.pyplot as plt
plt.rcParams['font.sans-serif']=['Microsoft YaHei']
#主程序
#主程序
function_name =14 #测试函数1-28
SearchAgents_no = 50#种群大小
Max_iter = 100#迭代次数
dim=10#维度 10/30/50/100
lb=-100*np.ones(dim)#下限
ub=100*np.ones(dim)#上限
cec_functions = cec2013(dim,function_name)
fobj=cec_functions.func#目标函数
BestX1,BestF1,curve1 = ABC(SearchAgents_no, Max_iter,lb,ub,dim,fobj)#问题求解
BestX2,BestF2,curve2 = PSO(SearchAgents_no, Max_iter,lb,ub,dim,fobj)#问题求解
BestX3,BestF3,curve3 = WOA(SearchAgents_no, Max_iter,lb,ub,dim,fobj)#问题求解
BestX4,BestF4,curve4 = CSO(SearchAgents_no, Max_iter,lb,ub,dim,fobj)#问题求解
BestX5,BestF5,curve5 = DBO(SearchAgents_no, Max_iter,lb,ub,dim,fobj)#问题求解
BestX6,BestF6,curve6 = DBO(SearchAgents_no, Max_iter,lb,ub,dim,fobj)#问题求解
#画收敛曲线图
Labelstr=['ABC','PSO','WOA','CSO','DBO','RFO']
Colorstr=['r','g','b','k','c','m']
if BestF1>0:
? ? plt.semilogy(curve1,color=Colorstr[0],linewidth=2,label=Labelstr[0])
? ? plt.semilogy(curve2,color=Colorstr[1],linewidth=2,label=Labelstr[1])
? ? plt.semilogy(curve3,color=Colorstr[2],linewidth=2,label=Labelstr[2])
? ? plt.semilogy(curve4,color=Colorstr[3],linewidth=2,label=Labelstr[3])
? ? plt.semilogy(curve5,color=Colorstr[4],linewidth=2,label=Labelstr[4])
? ? plt.semilogy(curve6,color=Colorstr[5],linewidth=2,label=Labelstr[5])
else:
? ? plt.plot(curve1,color=Colorstr[0],linewidth=2,label=Labelstr[0])
? ? plt.plot(curve2,color=Colorstr[1],linewidth=2,label=Labelstr[1])
? ? plt.plot(curve3,color=Colorstr[2],linewidth=2,label=Labelstr[2])
? ? plt.plot(curve4,color=Colorstr[3],linewidth=2,label=Labelstr[3])
? ? plt.plot(curve5,color=Colorstr[4],linewidth=2,label=Labelstr[4])
? ? plt.plot(curve6,color=Colorstr[5],linewidth=2,label=Labelstr[5])


plt.xlabel("Iteration")
plt.ylabel("Fitness")
plt.xlim(0,Max_iter)
plt.title("cec2013-F"+str(function_name))
plt.legend()
plt.savefig(str(function_name)+'.png')
plt.show()
#

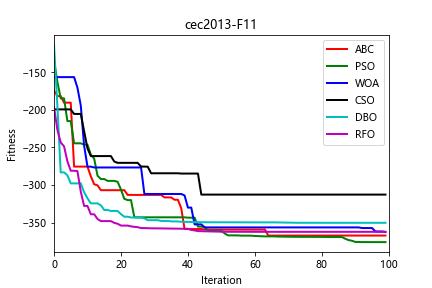
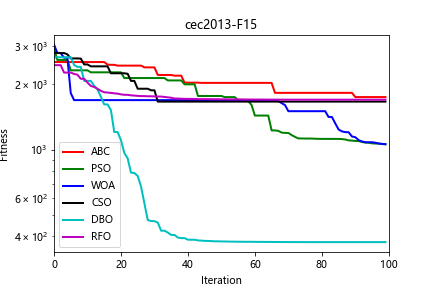
(3)部分结果


三、完整python代码
文章来源:https://blog.csdn.net/weixin_46204734/article/details/135209052
本文来自互联网用户投稿,该文观点仅代表作者本人,不代表本站立场。本站仅提供信息存储空间服务,不拥有所有权,不承担相关法律责任。 如若内容造成侵权/违法违规/事实不符,请联系我的编程经验分享网邮箱:chenni525@qq.com进行投诉反馈,一经查实,立即删除!
本文来自互联网用户投稿,该文观点仅代表作者本人,不代表本站立场。本站仅提供信息存储空间服务,不拥有所有权,不承担相关法律责任。 如若内容造成侵权/违法违规/事实不符,请联系我的编程经验分享网邮箱:chenni525@qq.com进行投诉反馈,一经查实,立即删除!
最新文章
- Python教程
- 深入理解 MySQL 中的 HAVING 关键字和聚合函数
- Qt之QChar编码(1)
- MyBatis入门基础篇
- 用Python脚本实现FFmpeg批量转换
- 设备树常用 OF 操作函数说明一
- 【开题报告】基于SpringBoot的水果仓库出入库管理系统的设计与实现
- Spring 如何解决循环依赖?
- C#高级 09 IEnumerable可枚举类型--可迭代类型
- DBeaver Community(社区版)下载及安装自用版
- 杨中科 ASP.NET Core前后端分离开发
- 全志魔术头
- 飞天使-k8s知识点6-kubernetes证书更新
- android 13 调整导航栏返回键和home键间距
- sql——窗口范围之partition by 与 order by