QCustomPlot绘制柱状图,折线图
发布时间:2024年01月19日
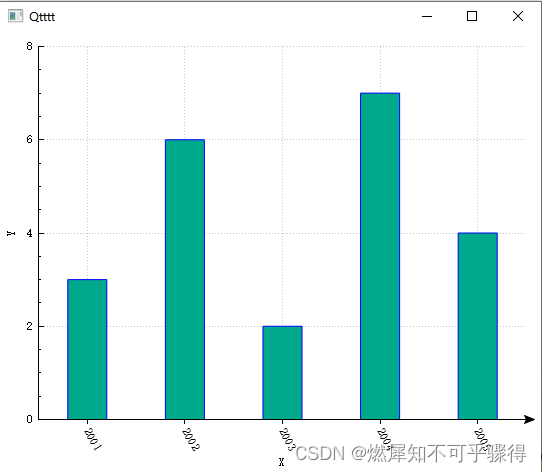
柱状图绘制
// 创建QCustomPlot对象
	QCustomPlot customPlot;

	// 创建柱状图数据
	QVector<double> xData = { 1, 2, 3, 4, 5 };
	QVector<double> yData = { 3, 6, 2, 7, 4 };

	// 创建柱状图数据容器
	QCPBars *bars = new QCPBars(customPlot.xAxis, customPlot.yAxis);
	bars->setData(xData, yData);
	//为柱状图设置一个文字类型的key轴,ticks决定了轴的范围,而labels决定了轴的刻度文字的显示
	QVector<double> ticks;
	QVector<QString> labels;
	ticks << 1 << 2 << 3 << 4 << 5 ;
	labels << "2001" << "2002" << "2003" << "2004" << "2005" ;
	QSharedPointer<QCPAxisTickerText> textTicker(new QCPAxisTickerText);
	textTicker->addTicks(ticks, labels);
	customPlot.xAxis->setTicker(textTicker); // 设置为文字轴
	customPlot.xAxis->setTickLabelRotation(60);     // 轴刻度文字旋转60度
	customPlot.xAxis->setSubTicks(false);           // 不显示子刻度
	customPlot.xAxis->setTickLength(0, 4);          // 轴内外刻度的长度分别是0,4,也就是轴内的刻度线不显示
	customPlot.xAxis->setRange(0, 6);               // 设置范围
	customPlot.xAxis->setUpperEnding(QCPLineEnding::esSpikeArrow);
	bars->setWidth(0.4);
	// 设置柱状图样式
	bars->setBrush(QColor(0, 168, 140));  // 设置柱状图颜色
	// 设置坐标轴范围和标签
	customPlot.xAxis->setLabel("X");
	customPlot.yAxis->setLabel("Y");
	customPlot.xAxis->setRange(0.5, 5.5);  // X轴范围从0.5到5.5
	customPlot.yAxis->setRange(0, 8);  // Y轴范围从0到8
	// 显示图表窗口
	customPlot.show();
如图所示
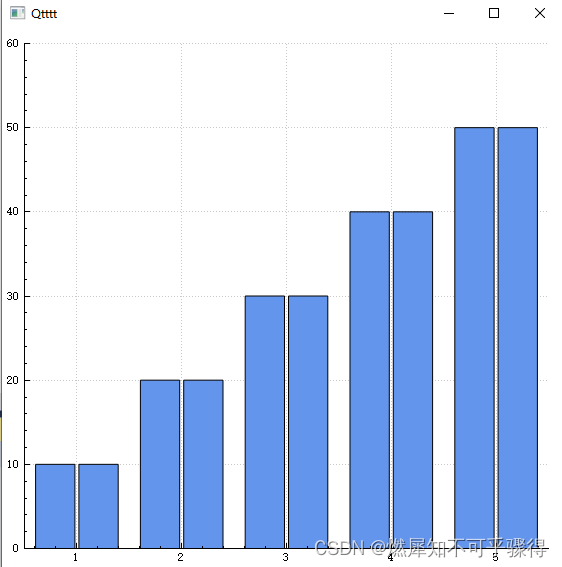
多组柱状图
// 创建QCustomPlot对象件
	QCustomPlot* customPlot = new QCustomPlot();
	customPlot->resize(400, 400);
	// 创建柱状图数据
	QVector<double> xData = { 1, 2, 3, 4, 5 };
	QVector<double> yData = { 10, 20, 30, 40, 50 };

	// 创建柱状图
	QCPBars* bars1= new QCPBars(customPlot->xAxis, customPlot->yAxis);
	QCPBars* bars2 = new QCPBars(customPlot->xAxis, customPlot->yAxis);

	QCPBarsGroup* group = new QCPBarsGroup(customPlot);
	bars1->setWidth(bars1->width() / 2);
	bars2->setWidth(bars2->width() / 2);

	group->append(bars1);
	group->append(bars2);

	bars1->setData(xData, yData);
	bars2->setData(xData, yData);

	// 设置柱状图样式
	QPen pen;
	pen.setWidthF(1);
	bars1->setPen(pen);
	bars1->setBrush(QColor(100, 149, 237));
	bars2->setPen(pen);
	bars2->setBrush(QColor(100, 149, 237));

	// 设置坐标轴范围
	customPlot->xAxis->setRange(0.5, 5.5);
	customPlot->yAxis->setRange(0, 60);

	// 显示图表
	customPlot->replot();
	customPlot->show();
如图所示:
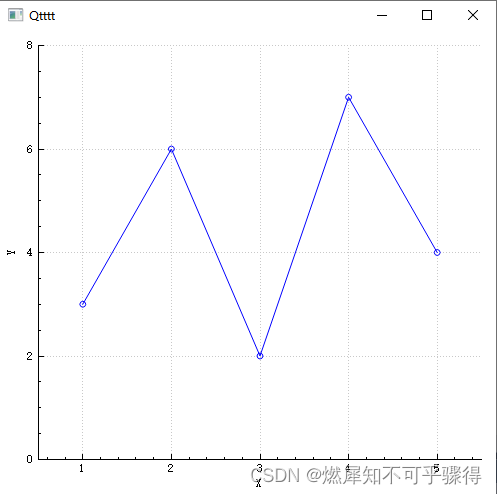
折线图绘制
	// 创建QCustomPlot对象
	QCustomPlot customPlot;

	// 创建折线图数据
	QVector<double> xData = { 1, 2, 3, 4, 5 };
	QVector<double> yData = { 3, 6, 2, 7, 4 };

	// 创建折线图数据容器
	customPlot.addGraph();
	customPlot.graph(0)->setData(xData, yData);

	// 设置折线图样式
	customPlot.graph(0)->setLineStyle(QCPGraph::lsLine);       // 设置线条风格为实线
	customPlot.graph(0)->setScatterStyle(QCPScatterStyle::ssCircle);  // 设置散点风格为圆形

	// 设置坐标轴范围和标签
	customPlot.xAxis->setLabel("X");
	customPlot.yAxis->setLabel("Y");
	customPlot.xAxis->setRange(0.5, 5.5);  // X轴范围从0.5到5.5
	customPlot.yAxis->setRange(0, 8);  // Y轴范围从0到8

	// 显示图表窗口
	customPlot.show();
文章来源:https://blog.csdn.net/qq_43611366/article/details/135698628
本文来自互联网用户投稿,该文观点仅代表作者本人,不代表本站立场。本站仅提供信息存储空间服务,不拥有所有权,不承担相关法律责任。 如若内容造成侵权/违法违规/事实不符,请联系我的编程经验分享网邮箱:chenni525@qq.com进行投诉反馈,一经查实,立即删除!
本文来自互联网用户投稿,该文观点仅代表作者本人,不代表本站立场。本站仅提供信息存储空间服务,不拥有所有权,不承担相关法律责任。 如若内容造成侵权/违法违规/事实不符,请联系我的编程经验分享网邮箱:chenni525@qq.com进行投诉反馈,一经查实,立即删除!
最新文章
- Python教程
- 深入理解 MySQL 中的 HAVING 关键字和聚合函数
- Qt之QChar编码(1)
- MyBatis入门基础篇
- 用Python脚本实现FFmpeg批量转换
- 力扣2085统计出现过一次的公共字符串
- JMM内存模型
- 用友U8+CRM help2 任意文件读取漏洞复现
- Nuxt2.x Error页面返回自定义请求状态码
- OpenCV - 小技巧
- gateway和base包+Jdk17和Jdk8版本切换(总结)
- 嵌入式学习-网络编程-Day6
- ecology-使用JAVA读取文件中的内容并且打印到控制台
- 11-组件组成:剖析 Docker 组件作用及其底层工作原理
- 腾讯云轻量服务器和云服务器CVM该怎么选?区别一览