Python绘制地球化学三角投图、梯形图、任意多边形图
发布时间:2024年01月12日
- 示例图片:

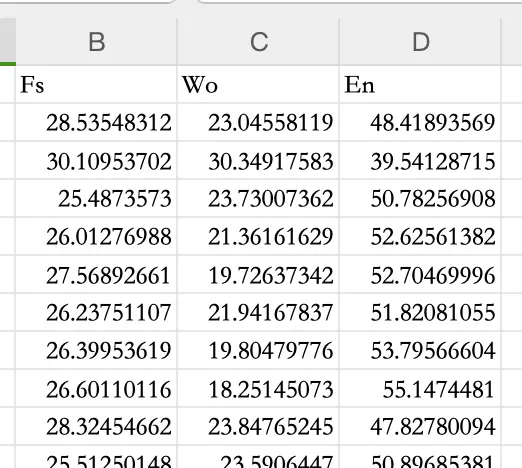
- 数据准备:
- 主要模块:pandas、matplotlib、mpltern
- 模块安装
pip install pandas matplotlib mpltern
- 完整代码:
# ************************************************************************
# _*_coding:utf-8_*_
# Author: Pandas120 (微信)
# Desription: 绘制地球化学三角投图、梯形图、任意多边形图
# ************************************************************************
import matplotlib.pyplot as plt
import mpltern
import pandas as pd
from matplotlib.ticker import MultipleLocator
plt.rcParams['font.family'] = 'Arial Unicode MS'
plt.rcParams['font.size'] = 10
plt.rcParams["pdf.fonttype"] = 42


data = pd.read_excel('Py-data.xlsx')

#创建画布大小
fig = plt.figure(figsize=(6,4))
#ternary_sum设置刻度范围最大值
ax = plt.subplot(projection='ternary',ternary_sum=100.0)
#绘制散点
pc = ax.scatter(data['Fs'], data['Wo'], data['En'],label='samples')
#绘制内部网格
ax.grid()

#截取顶部,绘制任意多边形修改下面参数范围即可
ax.set_ternary_lim(
    0, 50,  # rmin, rmax
    0, 100,  # lmin, lmax
    0, 100,  # bmin, bmax
)
#设置三元
ax.set_tlabel("Fs")
ax.set_llabel("Wo")
ax.set_rlabel("En")
#设置刻度
ax.taxis.set_major_locator(MultipleLocator(10))
ax.laxis.set_major_locator(MultipleLocator(10))
ax.raxis.set_major_locator(MultipleLocator(10))
#设置图例位置
ax.legend(loc=1)
plt.tight_layout()
fig.savefig('2.pdf')
plt.show()
文章来源:https://blog.csdn.net/lili_2014/article/details/135539103
本文来自互联网用户投稿,该文观点仅代表作者本人,不代表本站立场。本站仅提供信息存储空间服务,不拥有所有权,不承担相关法律责任。 如若内容造成侵权/违法违规/事实不符,请联系我的编程经验分享网邮箱:chenni525@qq.com进行投诉反馈,一经查实,立即删除!
本文来自互联网用户投稿,该文观点仅代表作者本人,不代表本站立场。本站仅提供信息存储空间服务,不拥有所有权,不承担相关法律责任。 如若内容造成侵权/违法违规/事实不符,请联系我的编程经验分享网邮箱:chenni525@qq.com进行投诉反馈,一经查实,立即删除!
最新文章
- Python教程
- 深入理解 MySQL 中的 HAVING 关键字和聚合函数
- Qt之QChar编码(1)
- MyBatis入门基础篇
- 用Python脚本实现FFmpeg批量转换
- 基于Web的仓储物流管理系统的设计与实现(源码+开题)
- java之文件预览功能的解决方案
- 期末加油站-图像处理期末知识点汇总
- Apache认证和授权
- C++ | 冒泡排序(指针数组函数)
- 探索 Vue3 (五) 骨架屏
- 秒杀倒计时等三种状态实现
- JS和TS的基础语法学习以及babel的基本使用
- jsp基于协同过滤课程推荐管理系统Myeclipse开发mysql数据库web结构java编程计算机网页项目
- 资助26项!基金委公布一批原创探索项目资助结果!