RANSAC(Random sample consensus)随机抽样一致性
算法介绍
RANSAC(Random Sample Consensus)是一种迭代的参数估计算法,用于从包含噪声和异常值的数据中拟合数学模型。它最初由Fischler和Bolles于1981年提出,被广泛应用于计算机视觉和计算机图形学等领域。
RANSAC的核心思想是随机选择数据中的一小部分样本,并根据这些样本拟合一个模型。然后,通过计算其他数据点到该模型的距离,并将距离小于一定阈值的数据点划分为内点,而距离大于阈值的数据点则划分为外点。重复此过程多次,并选择具有最多内点的模型作为最终的估计结果。
RANSAC算法的优点在于它对于大量异常值和噪声的数据有较好的鲁棒性。它可以估计出包含异常值的数据集中的准确模型,并且不要求事先知道异常值的数量,这种算法常被用于处理具有离群点或噪声的数据。
与最小二乘法相比,RANSAC的主要优点是对异常值的鲁棒性。最小二乘法试图最小化所有数据点的误差平方和,因此对异常值非常敏感。只要有一个数据点远离真实模型,就可能严重影响最小二乘法的结果。而RANSAC通过随机抽样和内点检测机制,能够有效地抵抗异常值的影响。
应用场景:
-
特征匹配:在图像配准和目标识别中,我们需要匹配两幅图像中的特征点。由于噪声和异常值的存在,直接匹配可能会得到错误的结果。RANSAC可以用于鲁棒地估计特征点之间的映射关系,从而提高匹配的准确性。
-
三维重建:在立体视觉和结构光扫描中,我们需要从多个视角的图像中重建三维结构。RANSAC可以用于估计相机的运动和场景的几何结构,从而实现鲁棒的三维重建。
-
运动估计:在视频分析和机器人导航中,我们需要估计物体或相机的运动。RANSAC可以用于从时间序列的图像数据中鲁棒地估计运动参数。
-
平面检测:在场景理解和物体检测中,我们需要从图像中检测平面。RANSAC可以用于从点云数据中鲁棒地检测平面。
-
校准:在相机校准和图像拼接中,我们需要估计图像之间的几何变换。RANSAC可以用于鲁棒地估计这些变换,从而实现准确的校准和拼接。
实现过程
下面的伪代码来源于维基百科,仔细读一下这份伪代码,它已经把算法的实现过程说的很明确了。
Given:
    data – A set of observations.
    model – A model to explain the observed data points.
    n – The minimum number of data points required to estimate the model parameters.
    k – The maximum number of iterations allowed in the algorithm.
    t – A threshold value to determine data points that are fit well by the model (inlier).
    d – The number of close data points (inliers) required to assert that the model fits well to the data.

Return:
    bestFit – The model parameters which may best fit the data (or null if no good model is found).


iterations = 0
bestFit = null
bestErr = something really large // This parameter is used to sharpen the model parameters to the best data fitting as iterations go on.

while iterations < k do
    maybeInliers := n randomly selected values from data
    maybeModel := model parameters fitted to maybeInliers
    confirmedInliers := empty set
    for every point in data do
        if point fits maybeModel with an error smaller than t then
             add point to confirmedInliers
        end if
    end for
    if the number of elements in confirmedInliers is > d then
        // This implies that we may have found a good model.
        // Now test how good it is.
        betterModel := model parameters fitted to all the points in confirmedInliers
        thisErr := a measure of how well betterModel fits these points
        if thisErr < bestErr then
            bestFit := betterModel
            bestErr := thisErr
        end if
    end if
    increment iterations
end while

return bestFit
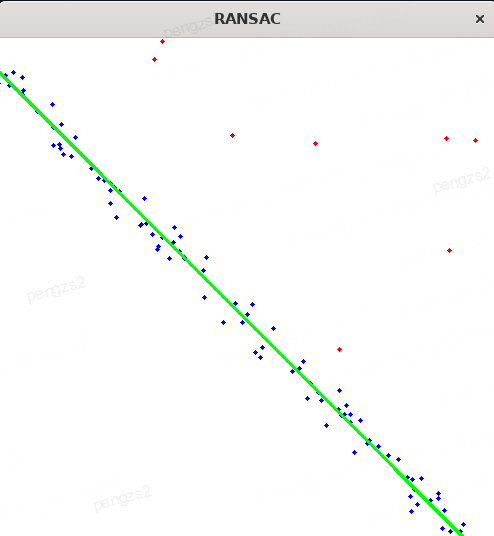
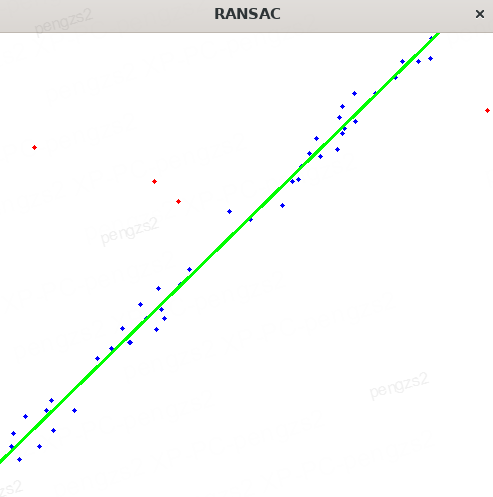
以直线拟合为例
随机构造一些散点,添加一部分噪声,用RANSAC的算法来拟合这些散点,结果示例如下:

实现
#include <iostream>
#include <vector>
#include <cmath>

#include "opencv2/opencv.hpp"

// define point
struct Point
{
    float x;
    float y;
};

// define line
struct Line
{
    float a;
    float b;
    float c;
    Line(){};
    Line(Point p1, Point p2)
    {
        a = p2.y - p1.y;
        b = p1.x - p2.x;
        c = p2.x * p1.y - p1.x * p2.y;
        reciprocal_sqrt_asq_plus_bsq = 1.0 / std::sqrt(a * a + b * b);
    }

    Line(float a, float b, float c)
    {
        this->a = a;
        this->b = b;
        this->c = c;
        reciprocal_sqrt_asq_plus_bsq = 1.0 / std::sqrt(a * a + b * b);
    }

    // calculate the distance from a point to a line
    float Distance(const Point &p)
    {
        if (reciprocal_sqrt_asq_plus_bsq < 0.0)
            reciprocal_sqrt_asq_plus_bsq = 1.0 / std::sqrt(a * a + b * b);
        return std::abs(a * p.x + b * p.y + c) * reciprocal_sqrt_asq_plus_bsq;
    }

private:
    float reciprocal_sqrt_asq_plus_bsq = -1.0; // 1 / sqrt(a^2 + b^2)
    // calculate the point to line distance
    // d = |ax + by + c| / sqrt(a^2 + b^2)
};

class MyRansac
{
public:
    MyRansac(){};
    ~MyRansac(){};
    Line FitLine(std::vector<Point> &points, int max_iterations, float distance_threshold)
    {
        Line best_line;
        int best_line_num_inliers = 0;
        for (int i = 0; i < max_iterations; i++)
        {
            // randomly select two points
            int idx1 = rand() % points.size();
            int idx2 = rand() % points.size();
            while (idx1 == idx2)
                idx2 = rand() % points.size();
            Point p1 = points[idx1];
            Point p2 = points[idx2];

            // fit line
            Line line(p1, p2);

            // count inliers
            int num_inliers = 0;
            for (int j = 0; j < points.size(); j++)
            {
                Point p = points[j];
                float distance = line.Distance(p);
                if (distance < distance_threshold)
                    num_inliers++;
            }

            // update best line
            if (num_inliers > best_line_num_inliers)
            {
                best_line_num_inliers = num_inliers;
                best_line = line;
                std::cout << "best_line_num_inliers: " << best_line_num_inliers << std::endl;
            }
        }
        return best_line;
    }
};

class PointFactory
{
public:
    std::vector<Point> CreatePoints(float slope, float intercept, int num_points, float x_min, float x_max, float noise)
    {
        std::vector<Point> points;
        for (int i = 0; i < num_points; i++)
        {
            float x = x_min + (x_max - x_min) * rand() / RAND_MAX;
            // float y = y_min + (y_max - y_min) * rand() / RAND_MAX;
            float y_line = slope * x + intercept;
            float y_noise = y_line + noise * rand() / RAND_MAX;
            Point p;
            p.x = x;
            p.y = y_noise;
            points.push_back(p);
        }

        // add outlier
        int num_outliers = num_points / 10;
        for (int i = 0; i < num_outliers; i++)
        {
            float x = x_min + (x_max - x_min) * rand() / RAND_MAX;
            float y = x_min + (x_max - x_min) * rand() / RAND_MAX;
            Point p;
            p.x = x;
            p.y = y;
            points.push_back(p);
        }
        return points;
    }
};

// visualize points and line
void Visualize(std::vector<Point> &points, Line &line, float distance_threshold = 0.0)
{
    cv::Mat img(500, 500, CV_8UC3, cv::Scalar(255, 255, 255));
    for (int i = 0; i < points.size(); i++)
    {
        Point p = points[i];
        float distance = line.Distance(p);
        if (distance < distance_threshold)
            cv::circle(img, cv::Point(p.x, p.y), 2, cv::Scalar(255, 0, 0), -1);
        else
            cv::circle(img, cv::Point(p.x, p.y), 2, cv::Scalar(0, 0, 255), -1);
    }
    if (std::abs(line.b) > 1e-6)
        cv::line(img, cv::Point(0, -line.c / line.b), cv::Point(img.cols, -(line.a * img.cols + line.c) / line.b), cv::Scalar(0, 255, 0), 2);

    cv::imshow("RANSAC", img);
    cv::waitKey(0);
}

int main(int argc, char *argv[])
{
    std::srand(std::time(nullptr));
    // create points
    PointFactory point_factory;
    float slope = 1;
    float intercept = 10.0;
    int num_points = 100;
    float x_min = 0.0;
    float x_max = 500.0;
    float noise = 50.0;
    std::vector<Point> points = point_factory.CreatePoints(slope, intercept, num_points, x_min, x_max, noise);

    // fit line
    MyRansac ransac;
    float distance_threshold = 20.0;
    int max_iterations = 1000;
    Line line = ransac.FitLine(points, max_iterations, distance_threshold);

    // visualize
    Visualize(points, line, distance_threshold);

    return 0;
}
参考连接
本文来自互联网用户投稿,该文观点仅代表作者本人,不代表本站立场。本站仅提供信息存储空间服务,不拥有所有权,不承担相关法律责任。 如若内容造成侵权/违法违规/事实不符,请联系我的编程经验分享网邮箱:chenni525@qq.com进行投诉反馈,一经查实,立即删除!
- Python教程
- 深入理解 MySQL 中的 HAVING 关键字和聚合函数
- Qt之QChar编码(1)
- MyBatis入门基础篇
- 用Python脚本实现FFmpeg批量转换
- 【华为OD机试真题2023C&D卷 JAVA&JS】执行任务赚积分
- 安裝火狐和穀歌流覽器插件FoxyProxy管理海外動態IP代理
- React初探:从环境搭建到Hooks应用全解析
- 如何根据水利需求选择合适的遥测终端机
- 西门子消防主机电源维修控制器BCB8005
- 万字详解RocketMq集群搭建步骤
- Pandas.DataFrame.iloc[ ] 筛选数据-自然索引法 详解 含代码 含测试数据集 随Pandas版本持续更新
- 如何使用不同的纹理贴图制作逼真的 3D 图形?
- 【python基础教程】print输出函数和range()函数的正确使用方式
- 最优传输学习及问题总结