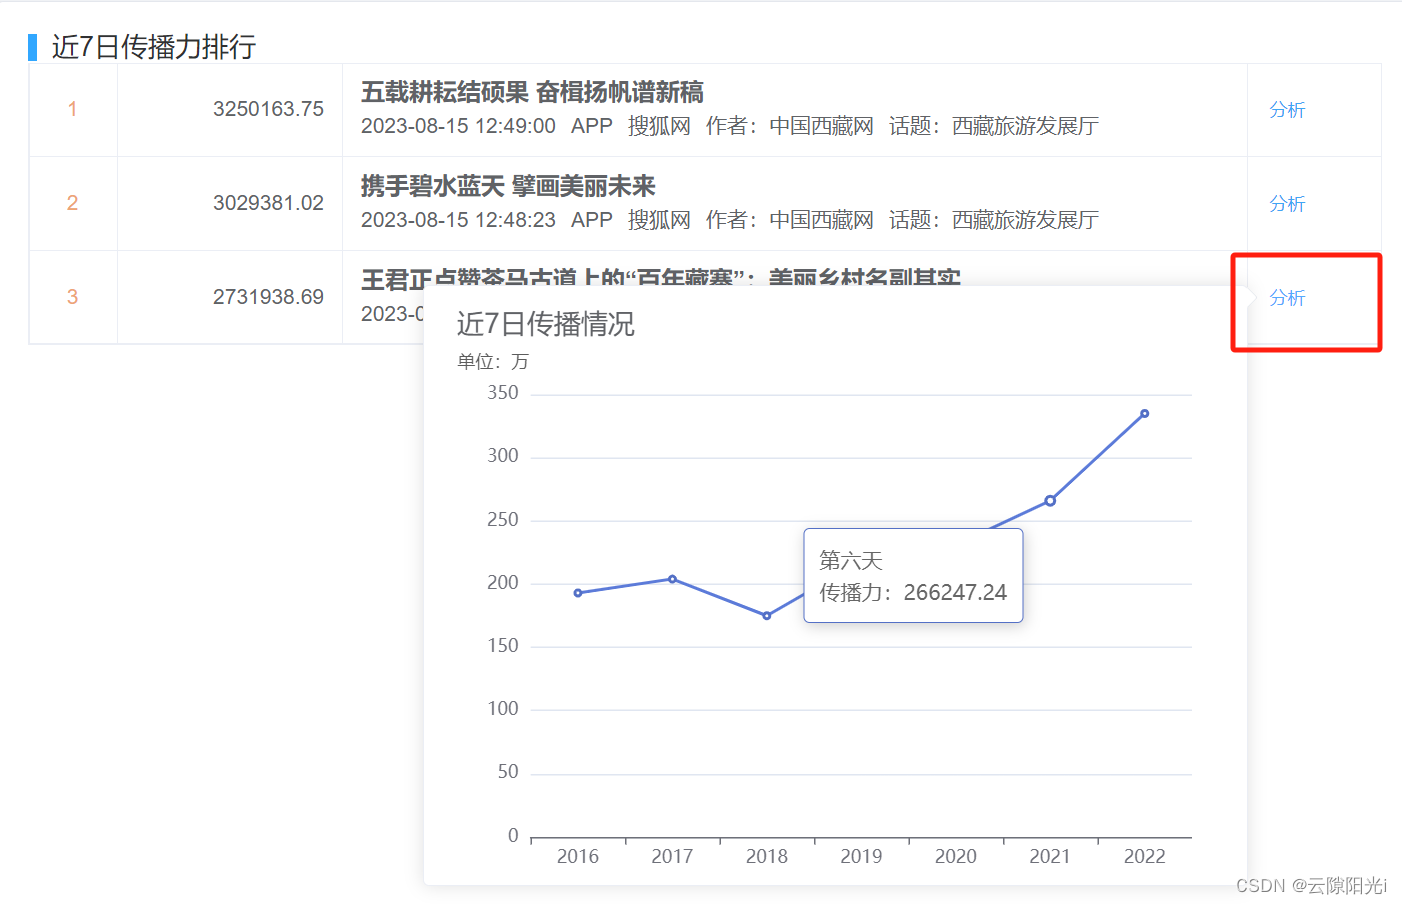
实现el-table操作列点击弹出echarts
发布时间:2023年12月17日
代码:
<el-table-column :width="90">
    <template #default="scope">
      <el-popover placement="left-end" width="550" trigger="click">
        <div>
          <div style="font-size: 18px; margin-left: 10px">近7日传播情况</div>
          <div
            :id="scope.row.index"
            :style="{ width: '500px', height: '350px' }"
          ></div>
        </div>

        <template #reference>
          <el-button
            :key="scope.$index + scope.row.id + '0'"
            @click="handleClick(scope.row)"
            type="primary"
            link
            size="small"
          >
            分析
          </el-button>
        </template>
      </el-popover>
    </template>
  </el-table-column>
方法:
let myChart1 = null;
let myChart2 = null;
let myChart3 = null;

let domId = ref("");
const handleClick = (row) => {
  domId.value = row.index;
  mychart();
};
const mychart = () => {
  setTimeout(() => {
    let myChart = "myChart" + domId.value;
    myChart = echarts.init(document.getElementById(domId.value));
    // 绘制图表
    myChart.setOption({
      grid: {
        // 直角坐标系内绘图网格
        left: "30", //grid 组件离容器左侧的距离,
        //left的值可以是80这样具体像素值,
        //也可以是'80%'这样相对于容器高度的百分比
        top: "10%",
        right: "0",
        bottom: "0",
        containLabel: true, //gid区域是否包含坐标轴的刻度标签。为true的时候,
        // left/right/top/bottom/width/height决定的是包括了坐标轴标签在内的
        //所有内容所形成的矩形的位置.常用于【防止标签溢出】的场景
      },
      tooltip: {
        trigger: "item",
        formatter: function (params) {
          let str1 = params.data.name;
          let str2 = params.data.num;
          let str = str1 + "<br />" + "传播力:" + str2;
          return str;
        },
      },
      xAxis: {
        type: "category",
        data: ["2016", "2017", "2018", "2019", "2020", "2021", "2022"],
      },
      yAxis: {
        type: "value",
        name: "单位:万",
        nameTextStyle: {
          color: "#5c5c5c",
          padding: [0, 50, 0, 0],
        },
      },
      series: [
        {
          name: "传播力",
          type: "line",
          data: [
            {
              name: "第一天",
              value: 193,
              num: 193321.33,
            },
            {
              name: "第二天",
              value: 204,
              num: 204556.73,
            },
            {
              name: "第三天",
              value: 175,
              num: 175284.06,
            },
            {
              name: "第四天",
              value: 218,
              num: 218246.24,
            },
            {
              name: "第五天",
              value: 231,
              num: 231092.75,
            },
            {
              name: "第六天",
              value: 266,
              num: 266247.24,
            },
            {
              name: "第七天",
              value: 335,
              num: 335274.95,
            },
          ],
        },
      ],
    });
    window.onresize = function () {
      // 自适应大小
      myChart.resize();
    };
  }, 200);
};
文章来源:https://blog.csdn.net/preoccupied_/article/details/135047387
本文来自互联网用户投稿,该文观点仅代表作者本人,不代表本站立场。本站仅提供信息存储空间服务,不拥有所有权,不承担相关法律责任。 如若内容造成侵权/违法违规/事实不符,请联系我的编程经验分享网邮箱:chenni525@qq.com进行投诉反馈,一经查实,立即删除!
本文来自互联网用户投稿,该文观点仅代表作者本人,不代表本站立场。本站仅提供信息存储空间服务,不拥有所有权,不承担相关法律责任。 如若内容造成侵权/违法违规/事实不符,请联系我的编程经验分享网邮箱:chenni525@qq.com进行投诉反馈,一经查实,立即删除!