prometheus grafana linux服务器监控
发布时间:2024年01月04日
前传
prometheus grafana的安装使用:https://nanxiang.blog.csdn.net/article/details/135384541
本文说下监控nginx,prometheus grafana linux 安装配置和监控
Docker 镜像下载地址: https://hub.docker.com
比较好的hub.docker.com///-- https://hub.docker.com/u/bitnami
grafana监控面板:https://grafana.com/grafana/dashboards
node-exporter安装
多台服务器安装node-exporter,用于采集服务器数据
docker pull bitnami/node-exporter:1.7.0

docker run -itd  --name node-exporter  --restart=always   -p 9100:9100  -v /etc/localtime:/etc/localtime -v /home/docker_data/monitor/node-exporter/proc:/host/proc:ro  -v /home/docker_data/monitor/node-exporter/sys:/host/sys:ro -v /home/docker_data/monitor/node-exporter/:/rootfs:ro  bitnami/node-exporter:1.7.0
配置promethues监控node节点
vim prometheus.yml
在Prometheus配置文件按以下内容修改:
scrape_configs:
  # The job name is added as a label `job=<job_name>` to any timeseries scraped from this config.
  - job_name: 'prometheus'

    # metrics_path defaults to '/metrics'
    # scheme defaults to 'http'.

    static_configs:
    - targets: ['localhost:9090']
      labels:
        instance: prometheus

  - job_name: linux-231
    static_configs:
    - targets: ['192.168.1.231:9100']                   #被监控端的IP地址和端口号(有多个被监控端可用 逗号 隔开)
  - job_name: linux-230
    static_configs:
    - targets: ['192.168.1.230:9100']
监控node-explorter ,模版:12884
grafana操作
官网:https://grafana.com/grafana/dashboards
模版下载:https://grafana.com/grafana/dashboards/12884-1-node-exporter-for-prometheus-dashboard-cn-v20200628/
在grafana仪表盘中导入12884模块,如果没有数据,可能是版本或者其他原因,尝试升级模块
查看promethues多少job节点
http://192.168.1.231:9090/targets
模版详情:
https://grafana.com/grafana/dashboards/12633-linux/
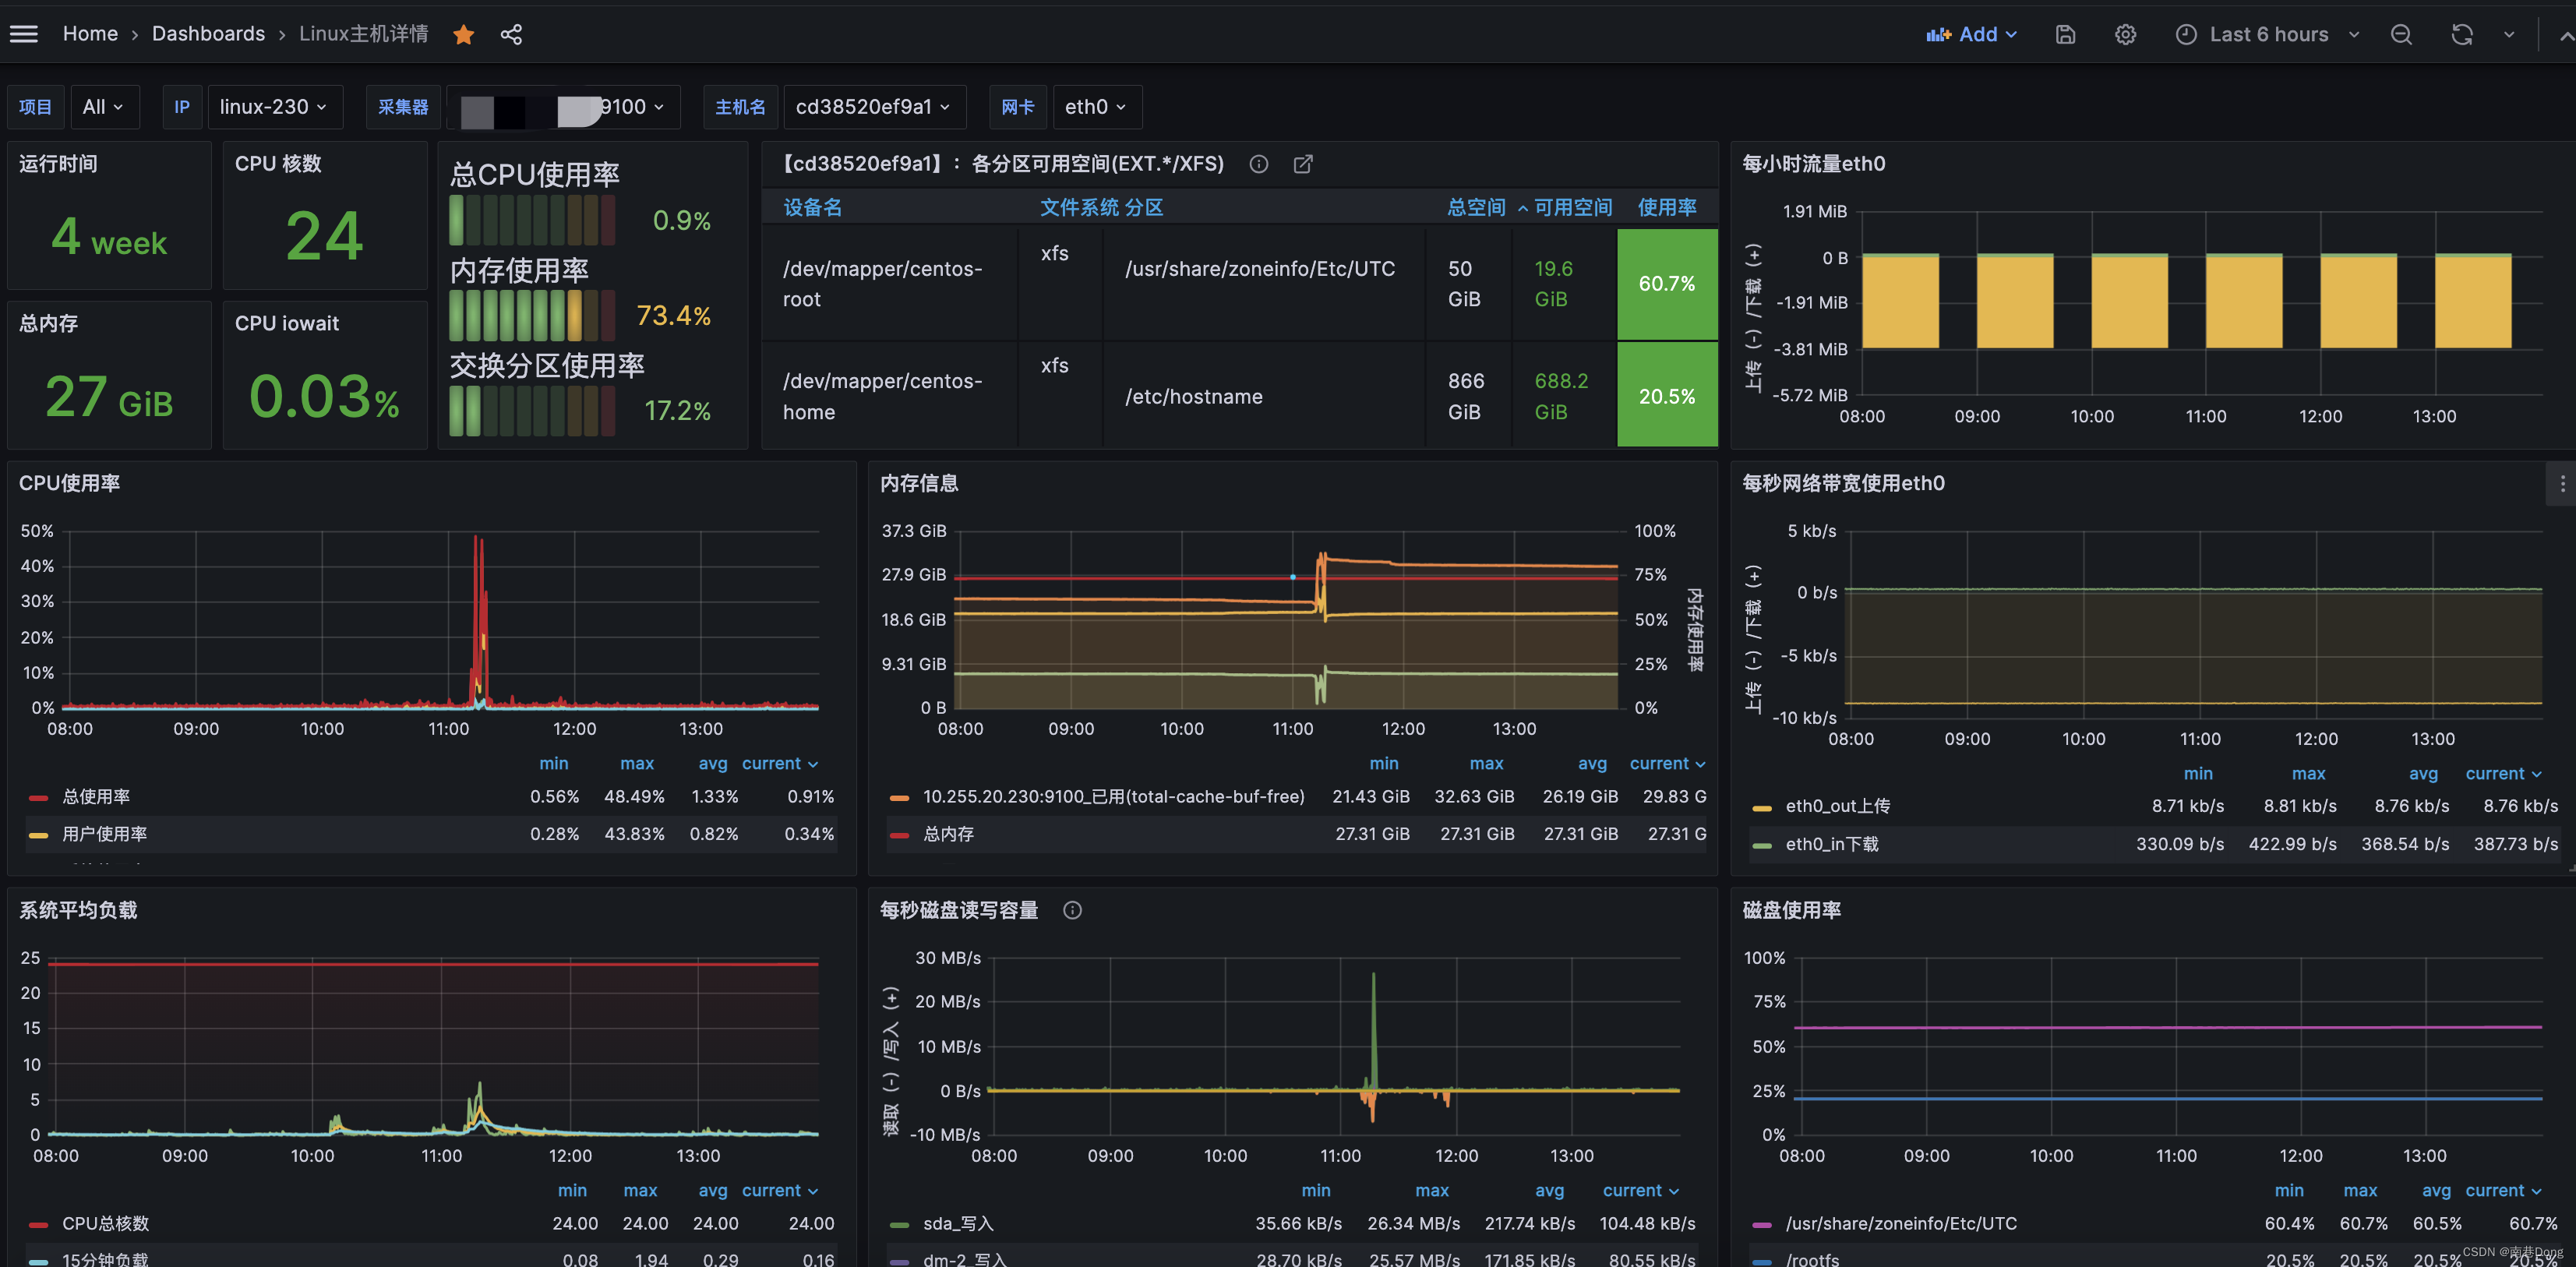
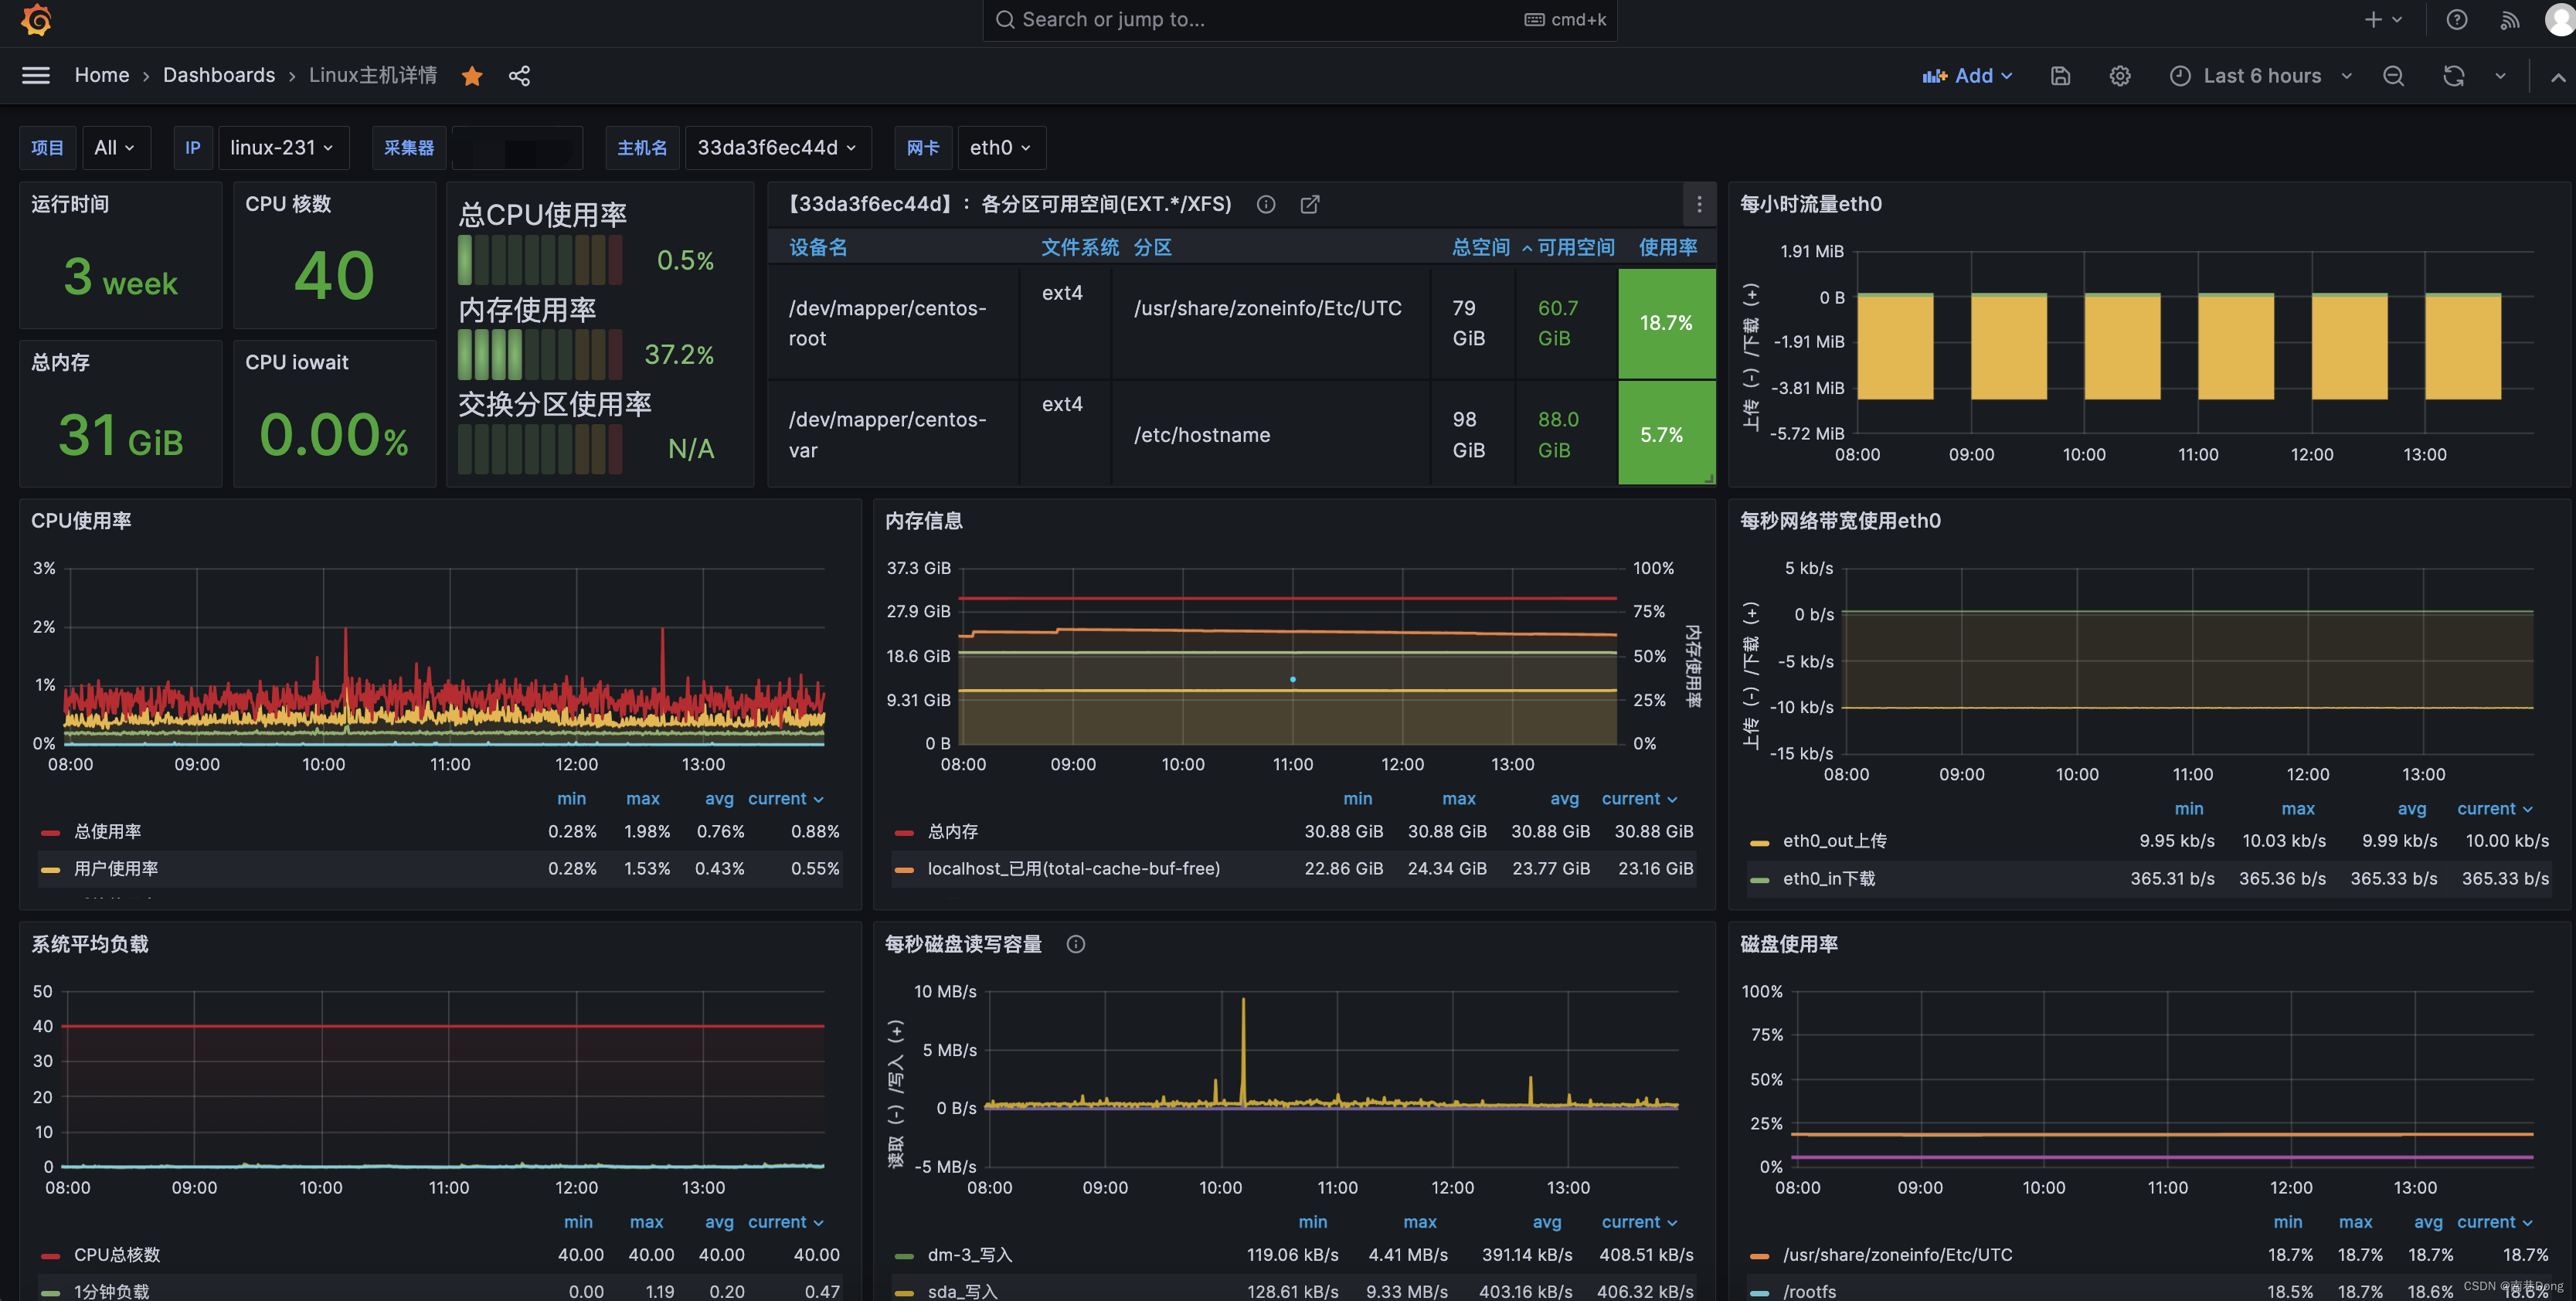
监控linux ,模版:12633/10180
查看监控:
230服务器:
231服务器:
外传
😜 原创不易,如若本文能够帮助到您的同学
🎉 支持我:关注我+点赞👍+收藏??
📝 留言:探讨问题,看到立马回复
💬 格言:己所不欲勿施于人 扬帆起航、游历人生、永不言弃!🔥
文章来源:https://blog.csdn.net/fclwd/article/details/135384975
本文来自互联网用户投稿,该文观点仅代表作者本人,不代表本站立场。本站仅提供信息存储空间服务,不拥有所有权,不承担相关法律责任。 如若内容造成侵权/违法违规/事实不符,请联系我的编程经验分享网邮箱:chenni525@qq.com进行投诉反馈,一经查实,立即删除!
本文来自互联网用户投稿,该文观点仅代表作者本人,不代表本站立场。本站仅提供信息存储空间服务,不拥有所有权,不承担相关法律责任。 如若内容造成侵权/违法违规/事实不符,请联系我的编程经验分享网邮箱:chenni525@qq.com进行投诉反馈,一经查实,立即删除!
最新文章