Python手写最小二乘法求解线性回归
发布时间:2024年01月02日
实现步骤
1.导包
import numpy as np
import matplotlib.pyplot as plt
2.读取数据
points = np.genfromtxt('data.csv', delimiter=',')

points[0,0]

# 提取points中的两列数据,分别作为x,y
x = points[:, 0]
y = points[:, 1]

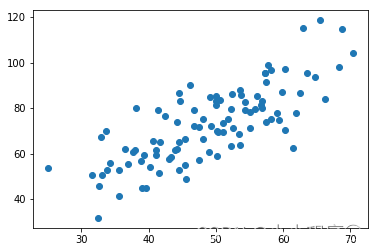
# 用plt画出散点图
plt.scatter(x, y)
plt.show()

3.定义损失函数
# 损失函数是系数的函数,另外还要传入数据的x,y
def compute_cost(w, b, points):
    total_cost = 0
    M = len(points)

    # 逐点计算平方损失误差,然后求平均数
    for i in range(M):
        x = points[i, 0]
        y = points[i, 1]
        total_cost += ( y - w * x - b ) ** 2

    return total_cost/M
4.定义算法拟合函数
# 先定义一个求均值的函数
def average(data):
    sum = 0
    num = len(data)
    for i in range(num):
        sum += data[i]
    return sum/num

# 定义核心拟合函数
def fit(points):
    M = len(points)
    x_bar = average(points[:, 0])

    sum_yx = 0
    sum_x2 = 0
    sum_delta = 0

    for i in range(M):
        x = points[i, 0]
        y = points[i, 1]
        sum_yx += y * ( x - x_bar )
        sum_x2 += x ** 2
    # 根据公式计算w
    w = sum_yx / ( sum_x2 - M * (x_bar**2) )

    for i in range(M):
        x = points[i, 0]
        y = points[i, 1]
        sum_delta += ( y - w * x )
    b = sum_delta / M

    return w, b
5.测试
w, b = fit(points)

print("w is: ", w)
print("b is: ", b)

cost = compute_cost(w, b, points)

print("cost is: ", cost)
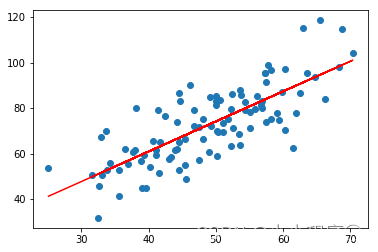
6.画出拟合曲线
plt.scatter(x, y)
# 针对每一个x,计算出预测的y值
pred_y = w * x + b

plt.plot(x, pred_y, c='r')
plt.show()

文章来源:https://blog.csdn.net/2201_75381449/article/details/135342466
本文来自互联网用户投稿,该文观点仅代表作者本人,不代表本站立场。本站仅提供信息存储空间服务,不拥有所有权,不承担相关法律责任。 如若内容造成侵权/违法违规/事实不符,请联系我的编程经验分享网邮箱:chenni525@qq.com进行投诉反馈,一经查实,立即删除!
本文来自互联网用户投稿,该文观点仅代表作者本人,不代表本站立场。本站仅提供信息存储空间服务,不拥有所有权,不承担相关法律责任。 如若内容造成侵权/违法违规/事实不符,请联系我的编程经验分享网邮箱:chenni525@qq.com进行投诉反馈,一经查实,立即删除!
最新文章
- Python教程
- 深入理解 MySQL 中的 HAVING 关键字和聚合函数
- Qt之QChar编码(1)
- MyBatis入门基础篇
- 用Python脚本实现FFmpeg批量转换
- 编程实践|如何使用MoonBit编写Pratt解析器?
- grep -A -B -C 输出匹配行及相邻行
- 【VTK-Rendering::Annotation】第一期 vtkCaptionActor2D
- 匈牙利算法 原理 python实现
- cesium学习笔记(问题记录)——(三)
- 精彩回顾:2023 SpinalHDL 应用前景探索研讨会
- 这些总线协议你真的全都了解过吗?
- 深入理解Kubernetes探针和.NET服务健康检查机制
- android之Handler详解
- 工业物联网是智能制造的实现途径