基于信用卡交易欺诈非均衡数据的处理
目录
3.2under_sampling RandomUnderSampler
?4.2over_sampling RandomOverSampler
import numpy as np
import pandas as pd
import sklearn
import matplotlib.pyplot as plt
import seaborn as sns
from sklearn.metrics import classification_report,accuracy_score
from sklearn.metrics import confusion_matrix
import warnings
warnings.filterwarnings("ignore")

from sklearn.svm import OneClassSVM
from pylab import rcParams
from sklearn.metrics import precision_score
rcParams['figure.figsize'] = 14, 8
RANDOM_SEED = 42
LABELS = ["Normal", "Fraud"]
一、数据处理
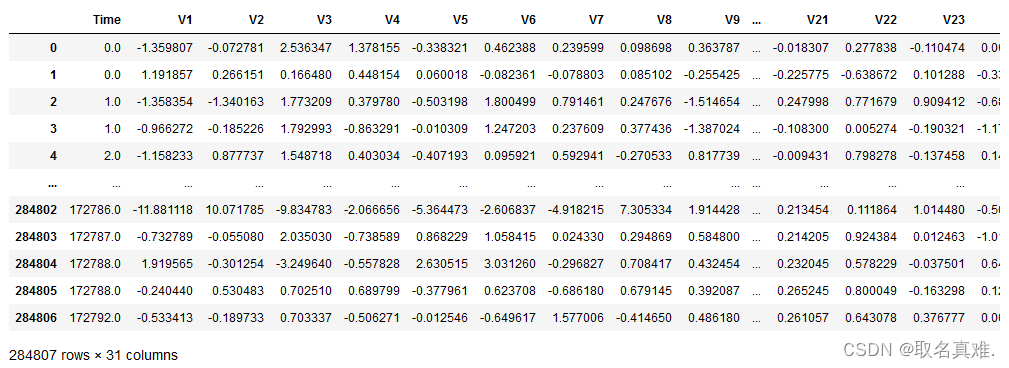
data = pd.read_csv('creditcard.csv',sep=',')
data.info()
'''结果:
<class 'pandas.core.frame.DataFrame'>
RangeIndex: 284807 entries, 0 to 284806
Data columns (total 31 columns):
 #   Column  Non-Null Count   Dtype
---  ------  --------------   -----
 0   Time    284807 non-null  float64
 1   V1      284807 non-null  float64
 2   V2      284807 non-null  float64
 3   V3      284807 non-null  float64
 4   V4      284807 non-null  float64
 5   V5      284807 non-null  float64
 6   V6      284807 non-null  float64
 7   V7      284807 non-null  float64
 8   V8      284807 non-null  float64
 9   V9      284807 non-null  float64
 10  V10     284807 non-null  float64
 11  V11     284807 non-null  float64
 12  V12     284807 non-null  float64
 13  V13     284807 non-null  float64
 14  V14     284807 non-null  float64
 15  V15     284807 non-null  float64
 16  V16     284807 non-null  float64
 17  V17     284807 non-null  float64
 18  V18     284807 non-null  float64
 19  V19     284807 non-null  float64
 20  V20     284807 non-null  float64
 21  V21     284807 non-null  float64
 22  V22     284807 non-null  float64
 23  V23     284807 non-null  float64
 24  V24     284807 non-null  float64
 25  V25     284807 non-null  float64
 26  V26     284807 non-null  float64
 27  V27     284807 non-null  float64
 28  V28     284807 non-null  float64
 29  Amount  284807 non-null  float64
 30  Class   284807 non-null  int64
dtypes: float64(30), int64(1)
memory usage: 67.4 MB
'''

Y = data['Class']
'''结果:
0         0
1         0
2         0
3         0
4         0
         ..
284802    0
284803    0
284804    0
284805    0
284806    0
Name: Class, Length: 284807, dtype: int64
'''

X = data.drop('Class',axis=1,inplace=False)

print(X.shape)
print(Y.shape)
#结果:(284807, 30)
#结果:(284807,)
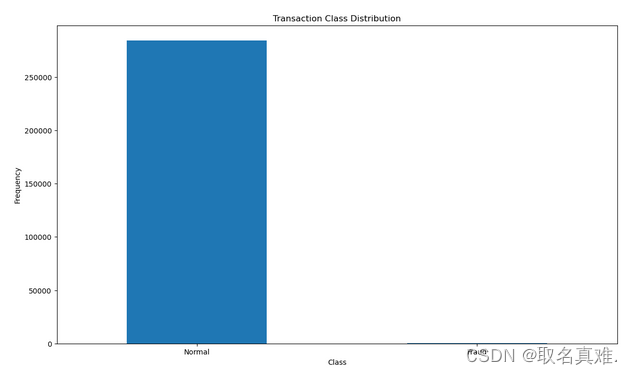
count_classes = pd.value_counts(data['Class'], sort = True)

count_classes.plot(kind = 'bar', rot=0)

plt.title("Transaction Class Distribution")

plt.xticks(range(2), LABELS)

plt.xlabel("Class")

plt.ylabel("Frequency")
## Get the Fraud and the normal dataset

fraud = data[data['Class']==1]#欺诈信息

normal = data[data['Class']==0]

print(fraud.shape,normal.shape)
#结果:(492, 31) (284315, 31)
#两类数据差距较大
?二、不做处理建模
from xgboost import XGBClassifier
from sklearn.model_selection import train_test_split
from sklearn.metrics import accuracy_score

X_train, X_test, y_train, y_test = train_test_split(X, Y, test_size=0.3, random_state=1)

model = XGBClassifier()
model.fit(X_train, y_train)
y_pred = model.predict(X_test)

accuracy = accuracy_score(y_test, y_pred)
print("Accuracy: %.2f%%" % (accuracy * 100.0))
#结果:Accuracy: 99.95%

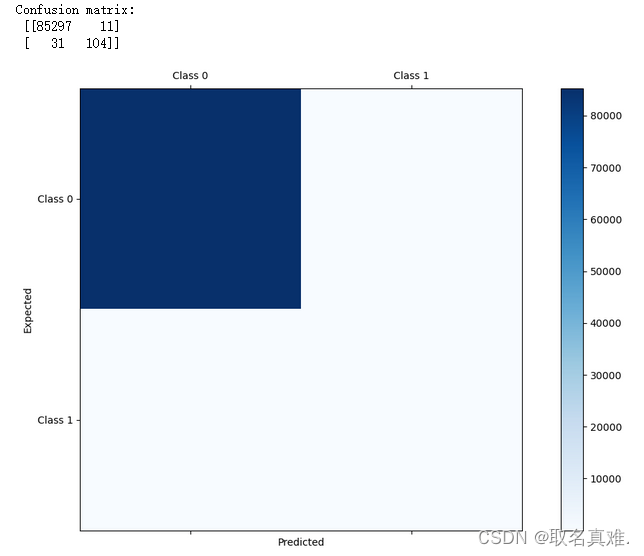
confusion_matrix(y_true=y_test, y_pred=y_pred)
'''结果:
array([[85297,    11],
       [   31,   104]], dtype=int64)
'''

precision_score(y_test, y_pred)
#结果:0.9043478260869565

#对于预测结果为0的较为准确,但是我们需要预测的是为1,欺诈数据
#不做处理建模的数据,对于0的准确,对于1的相对而言更不准确
from matplotlib import pyplot as plt
conf_mat = confusion_matrix(y_true=y_test, y_pred=y_pred)
print('Confusion matrix:\n', conf_mat)
labels = ['Class 0', 'Class 1']
fig = plt.figure()
ax = fig.add_subplot(111)
cax = ax.matshow(conf_mat, cmap=plt.cm.Blues)
fig.colorbar(cax)
ax.set_xticklabels([''] + labels)
ax.set_yticklabels([''] + labels)
plt.xlabel('Predicted')
plt.ylabel('Expected')
plt.show()
#对于预测结果为0的较为准确,但是我们需要预测的是为1,欺诈数据
#不做处理建模的数据,对于0的准确,对于1的相对而言更不准确
?三、under_sampling建模
Under-sampling是一种用于处理不平衡数据集的技术,主要用于解决分类问题中类别不平衡的情况。当一个类别的样本数量明显少于其他类别时,模型往往会对多数类别进行过度拟合,从而导致对少数类别的预测效果较差。
Under-sampling通过随机删除多数类别样本的方式来减少多数类别的样本数量,以使其与少数类别的样本数量相近。这样可以有效降低多数类别的影响,提高模型对少数类别的分类性能。
常见的Under-sampling方法包括:
- 随机欠采样(Random Under-Sampling):随机从多数类别中删除一些样本,使其数量与少数类别相等。
- 附近欠采样(NearMiss):根据距离度量选择多数类别样本的子集,以保留与少数类别样本最近的样本。
- Tomek链接(Tomek Links):删除多数类别样本和少数类别样本的Tomek链接,这些链接定义为在欧氏距离下最近邻关系中属于不同类别的样本对。
- Edited Nearest Neighbors(ENN):删除多数类别样本中被它们的最近邻分错的样本。
Under-sampling方法可以帮助提高模型的预测性能,但也会导致信息的损失,因此需要根据实际问题进行权衡和选择。
3.1under_sampling NearMiss?
from imblearn.under_sampling import NearMiss

nm = NearMiss()
X_res,y_res=nm.fit_resample(X,Y)

X_res.shape,y_res.shape
#结果:((984, 30), (984,))

from collections import Counter
print('Original dataset shape {}'.format(Counter(Y)))
print('Resampled dataset shape {}'.format(Counter(y_res)))
'''结果:
Original dataset shape Counter({0: 284315, 1: 492})
Resampled dataset shape Counter({0: 492, 1: 492})
将不平衡数据进行处理,将多的类数据减少到与少的数据一样
'''

X_train, X_test, y_train, y_test = train_test_split(X_res, y_res, test_size=0.3, random_state=1)

model = XGBClassifier()
model.fit(X_train, y_train)
y_pred = model.predict(X_test)

accuracy = accuracy_score(y_test, y_pred)
print("Accuracy: %.2f%%" % (accuracy * 100.0))
#结果:Accuracy: 95.61%

confusion_matrix(y_true=y_test, y_pred=y_pred)
'''结果:
array([[140,   2],
       [ 11, 143]], dtype=int64
'''

precision_score(y_test, y_pred)
#结果:0.986206896551724
3.2under_sampling RandomUnderSampler
from imblearn.under_sampling import RandomUnderSampler

rus = RandomUnderSampler(random_state=0)
rus.fit(X, Y)
X_res, y_res = rus.fit_resample(X, Y)

X_res.shape,y_res.shape
#结果:((984, 30), (984,))

from collections import Counter
print('Original dataset shape {}'.format(Counter(Y)))
print('Resampled dataset shape {}'.format(Counter(y_res)))
'''结果:
Original dataset shape Counter({0: 284315, 1: 492})
Resampled dataset shape Counter({0: 492, 1: 492})
'''

X_train, X_test, y_train, y_test = train_test_split(X_res, y_res, test_size=0.3, random_state=1)

model = XGBClassifier()
model.fit(X_train, y_train)
y_pred = model.predict(X_test)

accuracy = accuracy_score(y_test, y_pred)
print("Accuracy: %.2f%%" % (accuracy * 100.0))
#结果:Accuracy: 94.93%

confusion_matrix(y_true=y_test, y_pred=y_pred)
'''结果:
array([[139,   3],
       [ 12, 142]], dtype=int64)
'''

precision_score(y_test, y_pred)
#结果:0.9793103448275862
评价?
accuracy_score和precision_score是评估分类模型性能的指标,主要用于衡量模型的预测准确性和精确性。
accuracy_score(准确率)是指模型正确预测的样本数占总样本数的比例。它是一个简单直观的度量,适用于类别平衡的情况。然而,在类别不平衡的情况下,accuracy_score可能会产生误导性的结果,因为模型可能会倾向于预测多数类别。
precision_score(精确率)是指模型预测为正例的样本中,实际为正例的比例。它衡量了模型在将负例误判为正例时的错误率。precision_score适用于模型需要准确判断正例的任务,比如疾病诊断或垃圾邮件过滤。
区别总结如下:
- accuracy_score衡量了模型整体的准确性,precision_score衡量了模型在预测为正例时的准确性。
- accuracy_score对多数类别和少数类别的预测结果都一视同仁,而precision_score更注重少数类别(正例)的预测准确性。
- 在类别不平衡的情况下,accuracy_score可能不是一个合适的度量标准,而precision_score可以更好地评估模型的性能。
在实际应用中,我们通常需要综合考虑多个指标来评估模型的性能,以更全面地了解模型的表现。
我们可以看到通过under_sampling建模后,accuracy_score值虽然有所降低,但是precision_score值升高了,而accuracy_score对多数类别和少数类别的预测结果都一视同仁,而precision_score更注重少数类别(正例)的预测准确性。我们所测的交易欺诈为少数类别,所以更加准确,适合用under_sampling。
四、?over_sampling建模
4.1over_sampling SMOTETomek
SMOTETomek是一种结合了SMOTE(Synthetic Minority Over-sampling Technique)和Tomek Links的方法,用于处理不平衡数据集的一种采样技术。
在不平衡数据集中,少数类别的样本数量较少,导致模型在预测时可能倾向于预测多数类别,从而影响模型的性能。为了解决这个问题,可以使用过采样(over-sampling)和欠采样(under-sampling)的技术来平衡数据集。
SMOTE是一种过采样技术,它通过合成(synthesizing)新的少数类别样本来增加其数量。它基于少数类别样本之间的相似性,生成新的样本来扩充数据集。然而,SMOTE可能会生成过多的噪声样本,使得模型过拟合。
Tomek Links是一种欠采样技术,它通过检测少数类别样本之间的Tomek Links(即两个不同类别的样本之间的最近邻对)来删减样本。Tomek Links可以帮助剔除类别之间重叠的样本,从而提升模型的分类性能。
SMOTETomek结合了SMOTE和Tomek Links的方法,首先使用SMOTE生成合成样本来增加少数类别的数量,然后使用Tomek Links来删除类别之间的重叠样本,从而达到平衡数据集的目的。通过结合过采样和欠采样的技术,SMOTETomek能够有效处理不平衡数据集,并提升模型的性能。
from imblearn.combine import SMOTETomek

# Implementing Oversampling for Handling Imbalanced
smk = SMOTETomek(random_state=42)
X_res,y_res=smk.fit_resample(X,Y)

X_res.shape,y_res.shape
#结果:((567562, 30), (567562,))

from collections import Counter
print('Original dataset shape {}'.format(Counter(Y)))
print('Resampled dataset shape {}'.format(Counter(y_res)))
'''结果:
Original dataset shape Counter({0: 284315, 1: 492})
Resampled dataset shape Counter({0: 283781, 1: 283781})

欺诈类数据,较少的数据增多到与多的那类数据一样
'''

X_train, X_test, y_train, y_test = train_test_split(X_res, y_res, test_size=0.3, random_state=1)

model = XGBClassifier()
model.fit(X_train, y_train)
y_pred = model.predict(X_test)

accuracy = accuracy_score(y_test, y_pred)
print("Accuracy: %.2f%%" % (accuracy * 100.0))
#结果:Accuracy: 99.98%

confusion_matrix(y_true=y_test, y_pred=y_pred)
'''结果:
array([[85257,    36],
       [    0, 84976]], dtype=int64)
'''

precision_score(y_test, y_pred)
#结果:0.9995765303721827
?4.2over_sampling RandomOverSampler
from imblearn.over_sampling import RandomOverSampler

os =  RandomOverSampler(random_state=10)
X_res, y_res = os.fit_resample(X, Y)
X_res.shape,y_res.shape
#结果:((568630, 30), (568630,))

print('Original dataset shape {}'.format(Counter(Y)))
print('Resampled dataset shape {}'.format(Counter(y_res)))
'''结果:
Original dataset shape Counter({0: 284315, 1: 492})
Resampled dataset shape Counter({0: 284315, 1: 284315})
'''

X_train, X_test, y_train, y_test = train_test_split(X_res, y_res, test_size=0.3, random_state=1)

model = XGBClassifier()
model.fit(X_train, y_train)
y_pred = model.predict(X_test)

accuracy = accuracy_score(y_test, y_pred)
print("Accuracy: %.2f%%" % (accuracy * 100.0))
#结果:Accuracy: 99.99%

confusion_matrix(y_true=y_test, y_pred=y_pred)
'''结果:
array([[85412,    16],
       [    0, 85161]], dtype=int64)
'''

precision_score(y_test, y_pred)
#结果:0.9998121558636721
评价
明显用over_sampling来建模,不仅precision_score的值提高了,accuracy_score的值还没有降低,说明在预测交易欺诈这个数据集类型时,用over_sampling会更好
本文来自互联网用户投稿,该文观点仅代表作者本人,不代表本站立场。本站仅提供信息存储空间服务,不拥有所有权,不承担相关法律责任。 如若内容造成侵权/违法违规/事实不符,请联系我的编程经验分享网邮箱:chenni525@qq.com进行投诉反馈,一经查实,立即删除!
- Python教程
- 深入理解 MySQL 中的 HAVING 关键字和聚合函数
- Qt之QChar编码(1)
- MyBatis入门基础篇
- 用Python脚本实现FFmpeg批量转换
- 浏览器录屏技术探究与实践
- 通过浏览器URL地址,5分钟内渗透你的网站!很刑很可拷!
- 【PostgreSQL】函数与操作符-比较函数和操作符
- 美易官方:Vision Pro上市在即‘高端体验与舒适度的权衡’
- Ansibe自动化基础
- 苹果笔记本 macbook 在 office word 中使用 mathtype 的方法
- 基于ssm中小型餐厅网站的设计与实现论文
- Mysql 执行Select语句会发生的事情
- 并发程序设计--D10线程池及gdb调试多线程
- 教培机构管理系统哪个好?教培机构如虎添翼,管理系统不能少!