js:使用canvas画一个半圆
发布时间:2024年01月12日
背景
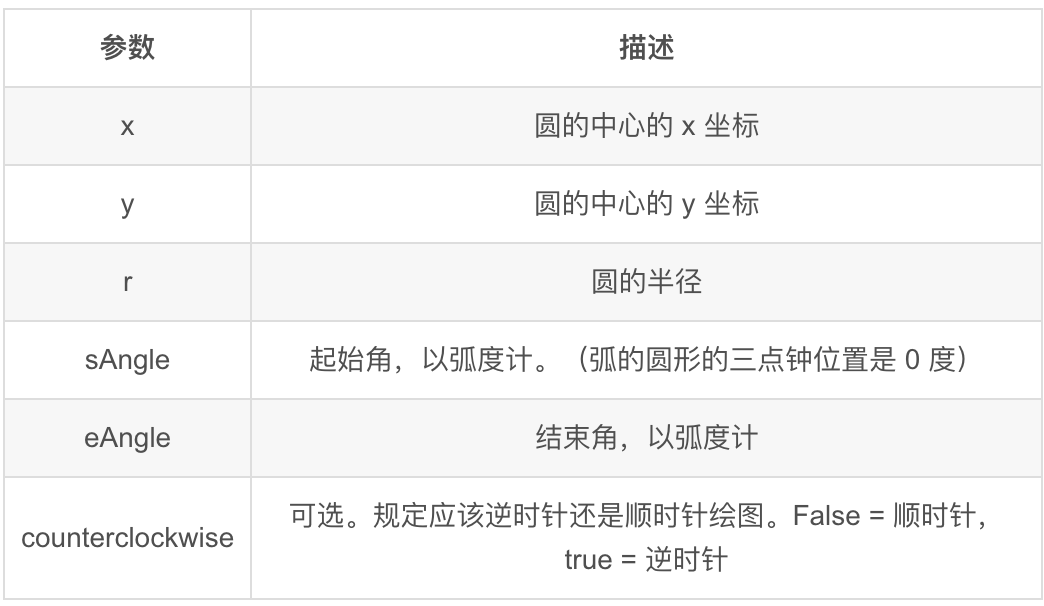
需求需要画一个半圆,或者多半圆,其实一下子就能想到 canvas 中的圆弧,核心使用 context.arc
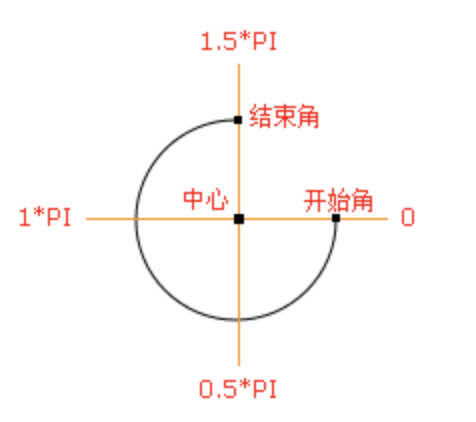
context.arc(x,y,r,sAngle,eAngle,counterclockwise)
接下来我们看看示例
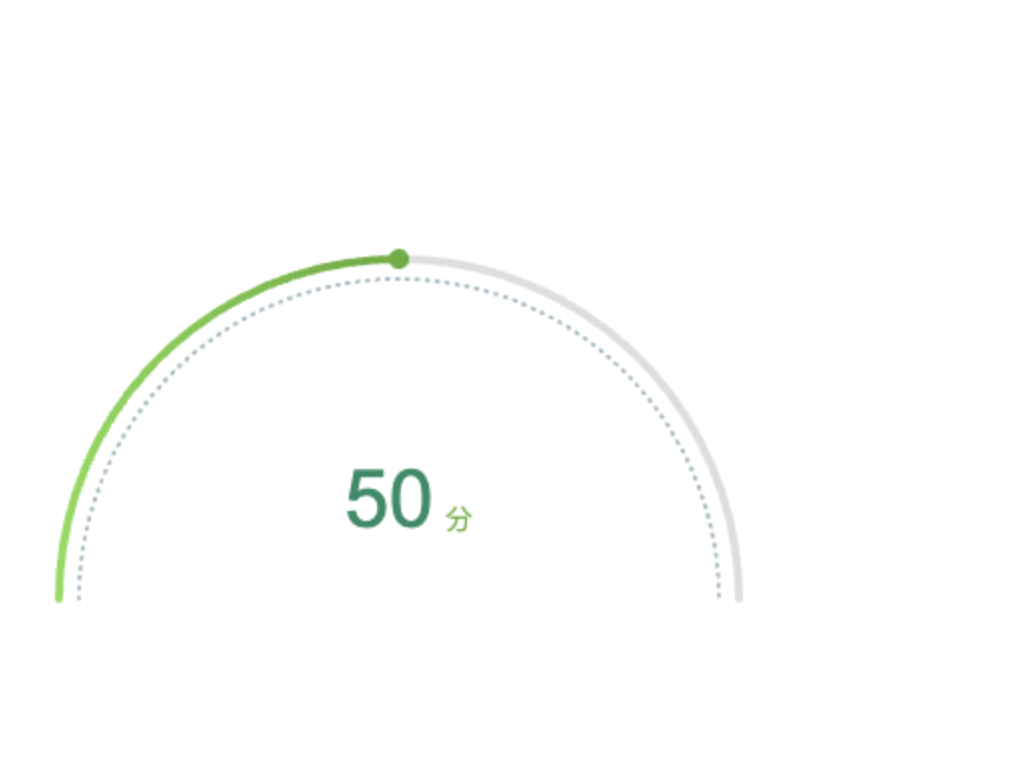
例一
<!DOCTYPE html>
<html lang="en">
<head>
  <meta charset="UTF-8">
  <meta name="viewport" content="width=device-width, initial-scale=1.0">
</head>
<body>

<canvas id="myCanvas" width="400" height="400"></canvas>

<script>
  const canvas = document.getElementById('myCanvas');
  const context = canvas.getContext('2d');
  const width = canvas.width;
  const height = canvas.height;
  const angle = 50; // 你的角度值
  const score = 50; // 你的分数值

  // 外层圆环
  context.beginPath();
  context.arc(width / 2, height - 20, width / 2 - 30, 1 * Math.PI, 2 * Math.PI);
  context.lineWidth = 4;
  context.lineCap = 'round';
  context.strokeStyle = '#DEDEDE';
  context.stroke();

  // 外层进度圆环
  context.beginPath();
  context.arc(width / 2, height - 20, width / 2 - 30, 1 * Math.PI, (1 + angle / 100) * Math.PI);
  context.lineWidth = 4;
  context.lineCap = 'round';
  const gnt1 = context.createLinearGradient(0, 0, 180, 0);
  gnt1.addColorStop(0, '#8ce459');
  gnt1.addColorStop(1, '#62af35');
  context.strokeStyle = gnt1;
  context.stroke();

  // 指示器
  const xAxis = Math.cos(Math.PI * 2 / 360 * (1.8 * (100 + angle))) * (width / 2 - 30);
  const yAxis = Math.sin(Math.PI * 2 / 360 * (1.8 * (100 + angle))) * (width / 2 - 30);
  context.beginPath();
  context.arc(width / 2 + xAxis, height - 20 + yAxis, 5, 0, 2 * Math.PI);
  context.fillStyle = '#5EAD35';
  context.fill();

  // 文本
  const textY = Math.sin(Math.PI * 2 / 360 * (1.8 * (100 + 15))) * (width / 2 - 30);
  context.fillStyle = '#168C66';
  context.font = '40px Arial';
  context.textAlign = 'center';
  context.textBaseline = 'middle';
  context.fillText(score, width / 2 - 5, height + 10 + textY);

  context.fillStyle = '#62AF35';
  context.font = '14px Arial';
  context.fillText('分', width / 2 + 30, height + 18 + textY);

  // 内层圆环
  context.beginPath();
  context.arc(width / 2, height - 20, width / 2 - 40, 1 * Math.PI, 2 * Math.PI);
  context.lineWidth = 2;
  context.setLineDash([1, 4]);
  context.lineCap = 'round';
  context.strokeStyle = '#A2BCC3';
  context.stroke();
</script>

</body>
</html>
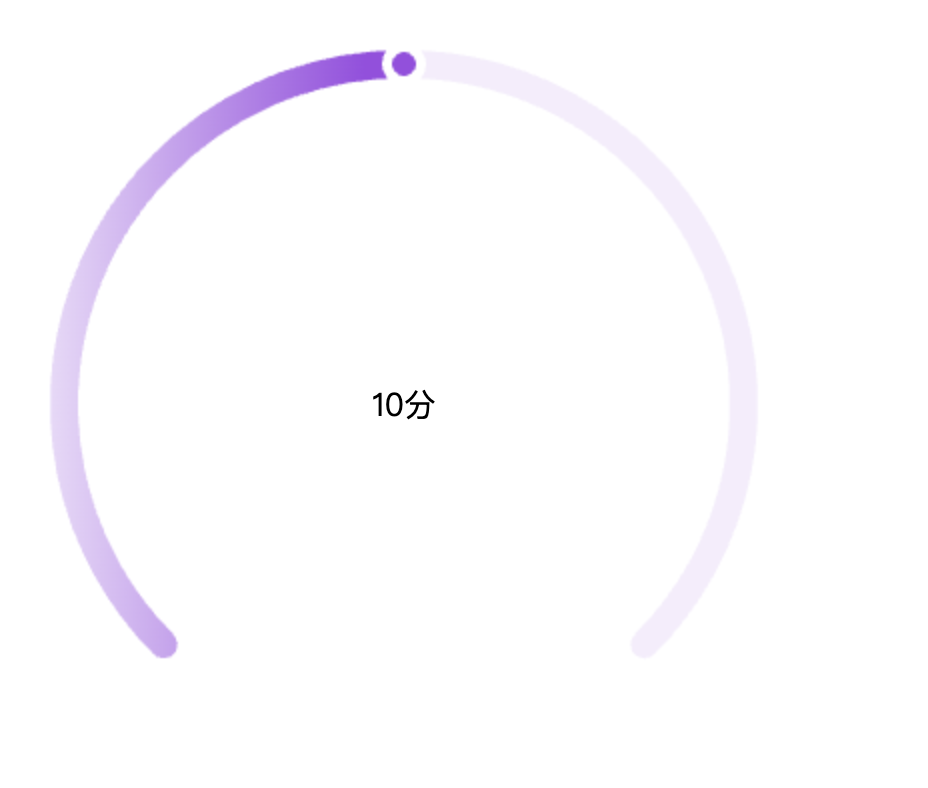
例二
<!DOCTYPE html>
<html lang="en">
<head>
  <meta charset="UTF-8">
  <meta name="viewport" content="width=device-width, initial-scale=1.0">
  <style>
    .canvas-main {
      width: 400px;
      height: 400px;
      position: relative;
    }
    .main-text {
      width: 100%;
      height: 100%;
      display: flex;
      align-items: center;
      justify-content: center;
      position: absolute;
      top: 0;
      left: 0;
    }
  </style>
</head>
<body>
<div class="canvas-main">
  <canvas id="main-canvas" width="400" height="400"></canvas>
  <div class="main-text">10分</div>
</div>

<script>
  const canvas = document.getElementById('main-canvas');
  const context = canvas.getContext('2d');
  const width = canvas.width;
  const height = canvas.height;
  const score = 50; // 你的分数值
  const totalScore = 100; // 总分
  const scorePercentage = score / totalScore; // 你的分数值占总分的百分比

  // 外层圆环
  context.beginPath();
  context.arc(width / 2, height / 2, width / 2 - 30, 0.75 * Math.PI, 2.25 * Math.PI, false);
  context.lineWidth = 14;
  context.lineCap = 'round';
  context.strokeStyle = '#f5edfc';
  context.stroke();

  // 外层进度圆环
  context.beginPath();
  // 最小-最大:0.75 * Math.PI 到 2.25 * Math.PI    2.25 - 0.75 = 1.5
  context.arc(width / 2, height / 2, width / 2 - 30, 0.75 * Math.PI, (0.75 + 1.5 * scorePercentage) * Math.PI, false);
  context.lineWidth = 14;
  context.lineCap = 'round';
  const gnt1 = context.createLinearGradient(0, 0, 180, 0);
  gnt1.addColorStop(0, '#f5edfc');
  gnt1.addColorStop(1, '#9c4ce3');
  context.strokeStyle = gnt1;
  context.stroke();

  // 指示器
  const indicatorAngle = 0.75 + 1.5 * scorePercentage;
  const indicatorRadius = width / 2 - 30;
  const indicatorX = width / 2 + Math.cos(indicatorAngle * Math.PI) * indicatorRadius;
  const indicatorY = height / 2 + Math.sin(indicatorAngle * Math.PI) * indicatorRadius;

  context.beginPath();
  context.arc(indicatorX, indicatorY, 10, 0, 2 * Math.PI); // 外圈半径设置为 10
  context.fillStyle = '#fff';
  context.strokeStyle = '#fff'; // 外圈线颜色也为白色
  context.lineWidth = 2; // 设置线宽,增加外圈线的宽度
  context.fill();
  context.stroke();

  // 指示器内部填充红色
  context.beginPath();
  context.arc(indicatorX, indicatorY, 6, 0, 2 * Math.PI);
  context.fillStyle = '#9c4ce3';
  context.fill();
</script>

</body>
</html>
小程序
如果是小程序的话,把 api 换一下
<canvas id="ring" canvas-id="ring" class="progress-canvas"></canvas>
Component({
  /**
   * 组件的属性列表
   */
  properties: {
    score: {
      type: Number
    },
    totalScore: {
      type: Number
    }
  },
  observers: {
    score: function(data) {
      if (data || data === 0) {
        this.init()
      }
    }
  },

  /**
   * 组件的方法列表
   */
  methods: {
    init() {
      const query = this.createSelectorQuery()
      query
        .select('#ring')
        .boundingClientRect(res => {
          this.drawRing(
            'ring',
            res.width,
            res.height,
            this.data.score,
            this.data.totalScore
          )
        })
        .exec()
    },
    drawRing: function(canvasId, width, height, score, totalScore) {
      var context = wx.createCanvasContext(canvasId, this)

      // const score = 50 // 你的分数值
      // const totalScore = 100 // 总分
      const scorePercentage = score / totalScore // 你的分数值占总分的百分比

      // 外层圆环
      context.beginPath()
      context.arc(
        width / 2,
        height / 2,
        width / 2 - 30,
        0.75 * Math.PI,
        2.25 * Math.PI,
        false
      )
      context.lineWidth = 14
      context.lineCap = 'round'
      context.strokeStyle = '#f5edfc'
      context.stroke()

      // 外层进度圆环
      context.beginPath()
      context.arc(
        width / 2,
        height / 2,
        width / 2 - 30,
        0.75 * Math.PI,
        (0.75 + 1.5 * scorePercentage) * Math.PI,
        false
      )
      context.lineWidth = 14
      context.lineCap = 'round'
      const gnt1 = context.createLinearGradient(0, 0, 180, 0)
      gnt1.addColorStop(0, '#f5edfc')
      gnt1.addColorStop(1, '#9c4ce3')
      context.strokeStyle = gnt1
      context.stroke()

      // 指示器
      const indicatorAngle = 0.75 + 1.5 * scorePercentage
      const indicatorRadius = width / 2 - 30
      const indicatorX =
        width / 2 + Math.cos(indicatorAngle * Math.PI) * indicatorRadius
      const indicatorY =
        height / 2 + Math.sin(indicatorAngle * Math.PI) * indicatorRadius

      // 指示器外圈
      context.beginPath()
      context.arc(indicatorX, indicatorY, 10, 0, 2 * Math.PI) // 外圈半径设置为 10
      context.setFillStyle('#fff')
      context.setStrokeStyle('#fff') // 外圈线颜色也为白色
      context.setLineWidth(2) // 设置线宽,增加外圈线的宽度
      context.fill()
      context.stroke()

      // 指示器内部填充红色
      context.beginPath()
      context.arc(indicatorX, indicatorY, 6, 0, 2 * Math.PI)
      context.setFillStyle('#9c4ce3')
      context.fill()

      context.draw()
    }
  }
})
文章来源:https://blog.csdn.net/weixin_43972437/article/details/135553859
本文来自互联网用户投稿,该文观点仅代表作者本人,不代表本站立场。本站仅提供信息存储空间服务,不拥有所有权,不承担相关法律责任。 如若内容造成侵权/违法违规/事实不符,请联系我的编程经验分享网邮箱:chenni525@qq.com进行投诉反馈,一经查实,立即删除!
本文来自互联网用户投稿,该文观点仅代表作者本人,不代表本站立场。本站仅提供信息存储空间服务,不拥有所有权,不承担相关法律责任。 如若内容造成侵权/违法违规/事实不符,请联系我的编程经验分享网邮箱:chenni525@qq.com进行投诉反馈,一经查实,立即删除!
最新文章
- Python教程
- 深入理解 MySQL 中的 HAVING 关键字和聚合函数
- Qt之QChar编码(1)
- MyBatis入门基础篇
- 用Python脚本实现FFmpeg批量转换
- express.js+mysql实现获取文章分类
- 关于java数组的使用
- Spring Boot Admin对SpringBoot服务进行监控
- liunx 添加路由指令
- 元素隐式具有 “any“ 类型,因为类型为 “string“ 的表达式不能用于索引类型 “typeof
- el-table/avue-curd 相同列内容合并
- 索引的概述和使用
- 【Python 千题 —— 基础篇】整数输入
- 总结js中遍历对象属性的方法
- 软件设计师——数据结构(一)