LVGL chart控件
发布时间:2023年12月27日
LVGL chart控件
基于lvgl 8.3.x
设置图表网格线
创建图表控件后,默认是非常丑的
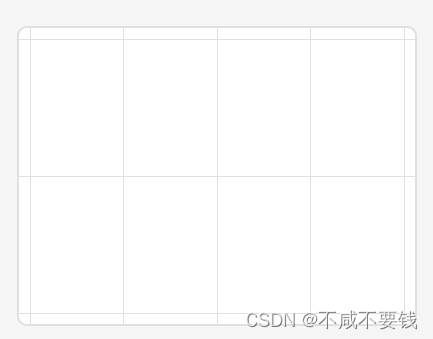
设置边框、圆角、背景色之类的和其他控件的API一样
    lv_obj_t* chart = lv_chart_create(screen);
    lv_obj_set_size(chart, 400, 300);
    lv_obj_set_pos(chart, 100, 100);
    lv_obj_set_style_radius(chart, 0, LV_PART_MAIN | LV_STATE_DEFAULT);
    lv_obj_set_style_border_width(chart, 1, LV_STATE_DEFAULT);
    lv_obj_set_style_border_side(chart, LV_BORDER_SIDE_LEFT, LV_STATE_DEFAULT);
    lv_obj_set_style_border_color(chart, lv_color_hex(0xafafaf), LV_STATE_DEFAULT);
    lv_obj_set_style_bg_color(chart, lv_color_hex(0xFF), 0);
使用图表时一般对图表内的网格线有要求。
- 网格线条数
	//设置网格线条数
    lv_chart_set_div_line_count(chart, 5, 0);
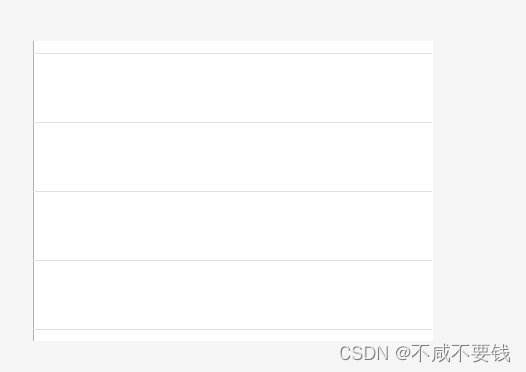
- 网格线离图表边缘的距离
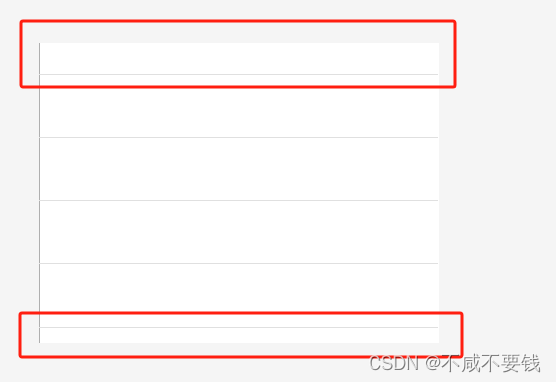
	//设置网格线离图表边缘的距离 下边15  上面30
    lv_obj_set_style_pad_all(chart, 0, LV_STATE_DEFAULT);
    lv_obj_set_style_pad_bottom(chart, 15, LV_STATE_DEFAULT);
    lv_obj_set_style_pad_top(chart, 30, LV_STATE_DEFAULT);
- 网格线颜色、宽度、虚实等
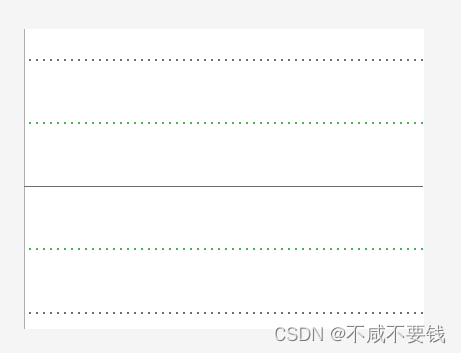
想对网格线进行更详细的控制,需要在图表重绘回调函数中对具体的颜色,宽度、虚线实线等进行特殊处理
/**
 * @brief chart 坐标网格线绘制
 * @param e
*/
static void draw_event_cb(lv_event_t* e)
{
    lv_obj_t* obj = lv_event_get_target(e);

    /*Add the faded area before the lines are drawn*/
    lv_obj_draw_part_dsc_t* dsc = lv_event_get_draw_part_dsc(e);
    if (dsc->part == LV_PART_MAIN) {
        if (dsc->line_dsc == NULL || dsc->p1 == NULL || dsc->p2 == NULL) return;

        /* 网格线 竖线 */
        if (dsc->p1->x == dsc->p2->x) {
            //dsc->line_dsc->color = lv_palette_lighten(LV_PALETTE_GREY, 1);
            //if (dsc->id == 1) {
            //    dsc->line_dsc->width = 0;
            //    dsc->line_dsc->dash_gap = 0;
            //    dsc->line_dsc->dash_width = 0;
            //}
            //else {
            //    dsc->line_dsc->width = 1;
            //    dsc->line_dsc->dash_gap = 6;
            //    dsc->line_dsc->dash_width = 6;
            //}
        }
        /* 网格线 横线 */
        else {
            if (dsc->id == 2 ) {
                /* 第二条线 宽度为1 实线 */
                dsc->line_dsc->width = 1;
                dsc->line_dsc->dash_gap = 0;
                dsc->line_dsc->dash_width = 0;
            }
            else {
                /* 其他线 宽度为2 虚线 */
                dsc->line_dsc->width = 2;
                dsc->line_dsc->dash_gap = 6;
                dsc->line_dsc->dash_width = 1;
            }

            if (dsc->id == 1 || dsc->id == 3) {
                /* 第1、2条线 颜色为绿色 */
                dsc->line_dsc->color = lv_palette_main(LV_PALETTE_GREEN);
            }
            else {
                dsc->line_dsc->color = lv_color_hex(0x6f6f6f);
            }
        }
    }
}
	//添加重绘回调函数
    lv_obj_add_event_cb(chart, draw_ev
    ent_cb, LV_EVENT_DRAW_PART_BEGIN, NULL);
设置图表坐标轴刻度线和标签
/**
 * Enumeration of the axis'
 */
enum {
    LV_CHART_AXIS_PRIMARY_Y     = 0x00,
    LV_CHART_AXIS_SECONDARY_Y   = 0x01,
    LV_CHART_AXIS_PRIMARY_X     = 0x02,
    LV_CHART_AXIS_SECONDARY_X   = 0x04,
    _LV_CHART_AXIS_LAST
};
lvgl的图表分为四个坐标轴,每个坐标轴都可以单独设置数据范围、刻度线和标签
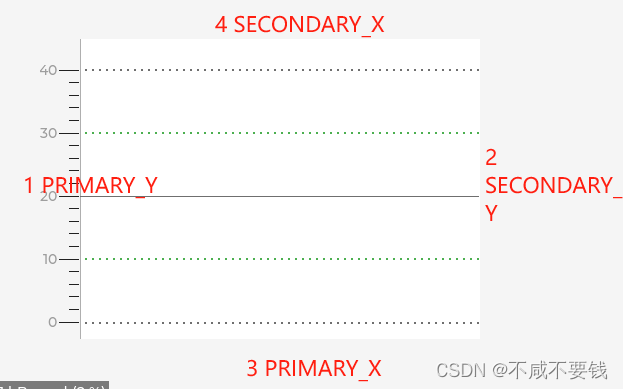
	//设置 PRIMARY_Y 轴范围 0-40
    lv_chart_set_range(chart, LV_CHART_AXIS_PRIMARY_Y, 0, 40);
    lv_chart_set_axis_tick(chart, LV_CHART_AXIS_PRIMARY_Y, 20, 10, 5, 5, true, 40);
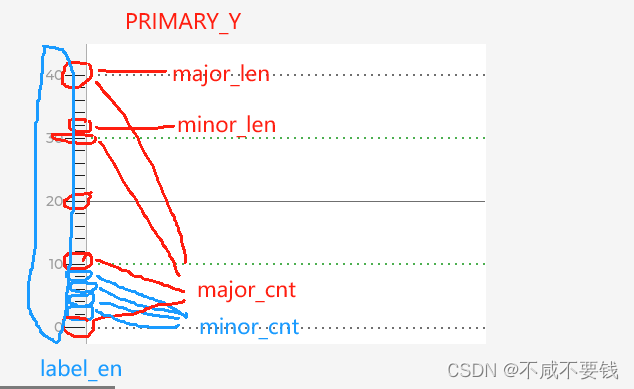
/**
 * Set the number of tick lines on an axis
 * @param obj           pointer to a chart object
 * @param axis          那个坐标轴
 * @param major_len     就是上图中主要刻度0、10、20、30、40 横杠的长度
 * @param minor_len     就是上图中次要刻度 横杠的长度
 * @param major_cnt     就是上图中主要刻度 的个数
 * @param minor_cnt     就是上图中两个主要刻度 之间分成 minor_cnt 分
 * @param label_en      是否使用标签
 * @param draw_size     刻度+标签宽度
 */
void lv_chart_set_axis_tick(lv_obj_t * obj, lv_chart_axis_t axis, lv_coord_t major_len, lv_coord_t minor_len,
                            lv_coord_t major_cnt, lv_coord_t minor_cnt, bool label_en, lv_coord_t draw_size);
设置刻度线颜色,标签字体和颜色
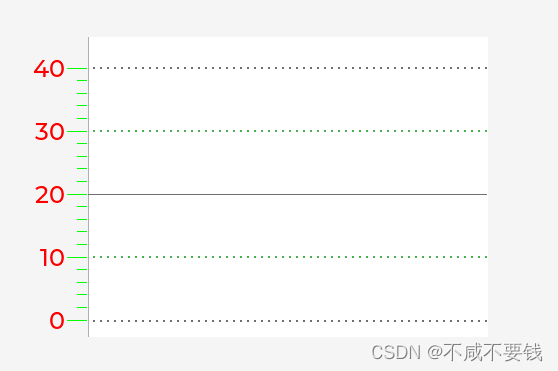
    //设置标签文本颜色 和 字体
    lv_obj_set_style_text_color(chart, lv_color_hex(0xFF0000), LV_PART_TICKS);
    lv_obj_set_style_text_font(chart, &lv_font_montserrat_24, LV_PART_TICKS);

    //设置刻度线颜色
    lv_obj_set_style_line_color(chart, lv_color_hex(0xFF00), LV_PART_TICKS);
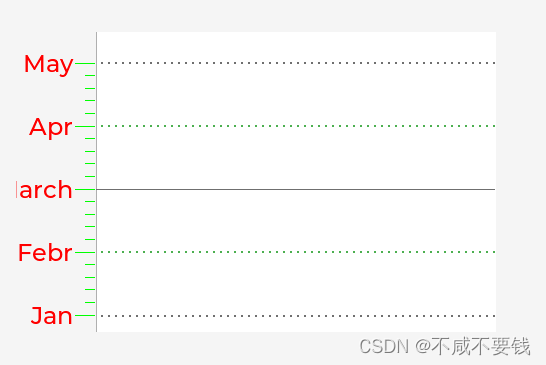
标签重绘
有时候不想要默认带的数字标签,想要替换成其他的,需要在重绘回调中对标签进行绘制。
static void draw_label_event_cb(lv_event_t* e)
{
    lv_obj_draw_part_dsc_t* dsc = lv_event_get_draw_part_dsc(e);
    if (!lv_obj_draw_part_check_type(dsc, &lv_chart_class, LV_CHART_DRAW_PART_TICK_LABEL)) return;

    if (dsc->id == LV_CHART_AXIS_PRIMARY_Y && dsc->text) {
        /* 修改标签字体 */
        //dsc->label_dsc->font = &lv_font_montserrat_24;
        const char* month[] = { "Jan", "Febr", "March", "Apr", "May", "Jun", "July", "Aug", "Sept", "Oct", "Nov", "Dec" };
        lv_snprintf(dsc->text, dsc->text_length, "%s", month[dsc->value/10]); //dsc->value 是实际标签的数值
    }
}
	//添加重绘回调函数
    lv_obj_add_event_cb(chart, draw_label_event_cb, LV_EVENT_DRAW_PART_BEGIN, NULL);
标签重绘显示小数
- 打开 lv_conf.h 中 宏
开启此宏后,lvgl的 label 可以使用 %f 显示浮点
lv_obj_t* label = lv_label_create(screen);
lv_label_set_text_fmt(label, “%.2f”, 123.5);
/*Change the built in (v)snprintf functions*/
#define LV_SPRINTF_CUSTOM 0
#if LV_SPRINTF_CUSTOM
    #define LV_SPRINTF_INCLUDE <stdio.h>
    #define lv_snprintf  snprintf
    #define lv_vsnprintf vsnprintf
#else   /*LV_SPRINTF_CUSTOM*/
    #define LV_SPRINTF_USE_FLOAT 1
#endif  /*LV_SPRINTF_CUSTOM*/
- 在重绘回调函数中 对原来标签进行缩放(对应的是原始数据需要进行相应的放大,图表不能直接显示浮点,只能间接进行显示)
/**
 * @brief chart 坐标网格线绘制
 * @param e
*/
static void draw_event_cb(lv_event_t* e)
{
    lv_obj_t* obj = lv_event_get_target(e);

    /*Add the faded area before the lines are drawn*/
    lv_obj_draw_part_dsc_t* dsc = lv_event_get_draw_part_dsc(e);
    if (dsc->part == LV_PART_MAIN) {
        if (dsc->line_dsc == NULL || dsc->p1 == NULL || dsc->p2 == NULL) return;

        /* 网格线 竖线 */
        if (dsc->p1->x == dsc->p2->x) {
            //dsc->line_dsc->color = lv_palette_lighten(LV_PALETTE_GREY, 1);
            //if (dsc->id == 1) {
            //    dsc->line_dsc->width = 0;
            //    dsc->line_dsc->dash_gap = 0;
            //    dsc->line_dsc->dash_width = 0;
            //}
            //else {
            //    dsc->line_dsc->width = 1;
            //    dsc->line_dsc->dash_gap = 6;
            //    dsc->line_dsc->dash_width = 6;
            //}
        }
        /* 网格线 横线 */
        else {
            if (dsc->id == 2 ) {
                /* 第二条线 宽度为1 实线 */
                dsc->line_dsc->width = 1;
                dsc->line_dsc->dash_gap = 0;
                dsc->line_dsc->dash_width = 0;
            }
            else {
                /* 其他线 宽度为2 虚线 */
                dsc->line_dsc->width = 2;
                dsc->line_dsc->dash_gap = 6;
                dsc->line_dsc->dash_width = 1;
            }

            if (dsc->id == 1 || dsc->id == 3) {
                /* 第1、2条线 颜色为绿色 */
                dsc->line_dsc->color = lv_palette_main(LV_PALETTE_GREEN);
            }
            else {
                dsc->line_dsc->color = lv_color_hex(0x6f6f6f);
            }
        }
    }
}
static void draw_label_event_cb(lv_event_t* e)
{
    lv_obj_draw_part_dsc_t* dsc = lv_event_get_draw_part_dsc(e);
    if (!lv_obj_draw_part_check_type(dsc, &lv_chart_class, LV_CHART_DRAW_PART_TICK_LABEL)) return;

    if (dsc->id == LV_CHART_AXIS_PRIMARY_Y && dsc->text) {
        lv_snprintf(dsc->text, dsc->text_length, "%.2f", dsc->value/10.0f); //dsc->value 是实际标签的数值
    }
}

static lv_obj_t* chart_test(void)
{

    lv_obj_t* screen = lv_obj_create(NULL);

    lv_obj_t* chart = lv_chart_create(screen);
    lv_obj_set_size(chart, 400, 300);
    lv_obj_set_pos(chart, 100, 100);
    lv_obj_set_style_radius(chart, 0, LV_PART_MAIN | LV_STATE_DEFAULT);
    lv_obj_set_style_border_width(chart, 1, LV_STATE_DEFAULT);
    lv_obj_set_style_border_side(chart, LV_BORDER_SIDE_LEFT, LV_STATE_DEFAULT);
    lv_obj_set_style_border_color(chart, lv_color_hex(0xafafaf), LV_STATE_DEFAULT);
    lv_obj_set_style_bg_color(chart, lv_color_hex(0xFFFFFF), 0);

    //设置网格线条数
    lv_chart_set_div_line_count(chart, 5, 0);

    //设置网格线离图表边缘的距离
    lv_obj_set_style_pad_all(chart, 0, LV_STATE_DEFAULT);
    lv_obj_set_style_pad_bottom(chart, 15, LV_STATE_DEFAULT);
    lv_obj_set_style_pad_top(chart, 30, LV_STATE_DEFAULT);

    //添加重绘回调函数
    lv_obj_add_event_cb(chart, draw_event_cb, LV_EVENT_DRAW_PART_BEGIN, NULL);

    //lv_chart_set_type(chart, LV_CHART_TYPE_LINE);   /*Show lines and points too*/

    //设置 PRIMARY_Y 轴范围 0-40
    lv_chart_set_range(chart, LV_CHART_AXIS_PRIMARY_Y, 0, 40);
    lv_chart_set_axis_tick(chart, LV_CHART_AXIS_PRIMARY_Y, 20, 10, 5, 5, true, 80);

    //设置标签文本颜色 和 字体
    lv_obj_set_style_text_color(chart, lv_color_hex(0xFF0000), LV_PART_TICKS);
    lv_obj_set_style_text_font(chart, &lv_font_montserrat_24, LV_PART_TICKS);

    //设置刻度线颜色 和 宽度
    lv_obj_set_style_line_color(chart, lv_color_hex(0xFF00), LV_PART_TICKS);
    lv_obj_set_style_line_width(chart, 2, LV_PART_TICKS);

    //添加重绘回调函数
    lv_obj_add_event_cb(chart, draw_label_event_cb, LV_EVENT_DRAW_PART_BEGIN, NULL);

    return screen;
}
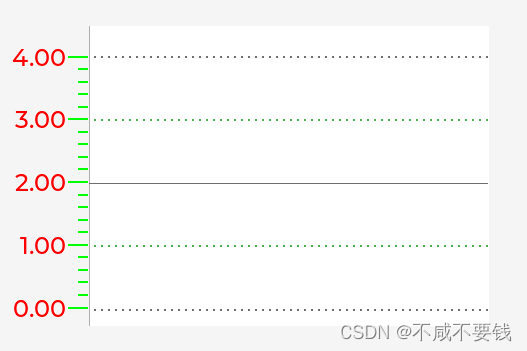
折线图
折线图起始点有竖线问题
	//设置为折线图
    lv_chart_set_type(chart, LV_CHART_TYPE_LINE);

    //为 PRIMARY_Y 轴添加一条折线
    lv_obj_t* series = lv_chart_add_series(chart, lv_color_hex(0x00ffff), LV_CHART_AXIS_PRIMARY_Y);

    lv_chart_set_point_count(chart, 400);

    //设置线宽
    lv_obj_set_style_line_width(chart, 2, LV_PART_ITEMS);
    lv_obj_set_style_line_rounded(chart, 1, LV_PART_ITEMS);

    //不显示数据点
    lv_obj_set_style_size(chart, 0, LV_PART_INDICATOR);

    for (int i = 0; i < 200; i++) {
        lv_chart_set_next_value(chart, series, i/10);
    }
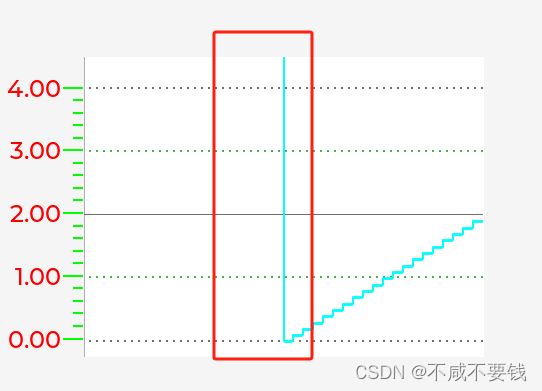
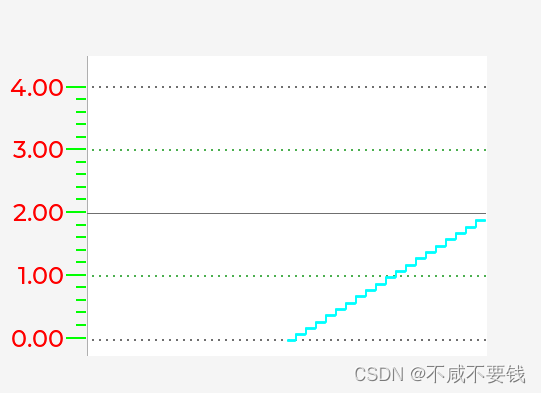
发现折线图起始点有一条竖线,想要这个线消失,可以修改源码 lv_chart.c 中画折线函数
static void draw_series_line(lv_obj_t * obj, lv_draw_ctx_t * draw_ctx)
{
    lv_area_t clip_area;
    if(_lv_area_intersect(&clip_area, &obj->coords, draw_ctx->clip_area) == false) return;

    const lv_area_t * clip_area_ori = draw_ctx->clip_area;
    draw_ctx->clip_area = &clip_area;

    lv_chart_t * chart  = (lv_chart_t *)obj;
    if(chart->point_cnt < 2) return;

    uint16_t i;
    lv_point_t p1;
    lv_point_t p2;
    lv_coord_t border_width = lv_obj_get_style_border_width(obj, LV_PART_MAIN);
    lv_coord_t pad_left = lv_obj_get_style_pad_left(obj, LV_PART_MAIN) + border_width;
    lv_coord_t pad_top = lv_obj_get_style_pad_top(obj, LV_PART_MAIN) + border_width;
    lv_coord_t w     = ((int32_t)lv_obj_get_content_width(obj) * chart->zoom_x) >> 8;
    lv_coord_t h     = ((int32_t)lv_obj_get_content_height(obj) * chart->zoom_y) >> 8;
    lv_coord_t x_ofs = obj->coords.x1 + pad_left - lv_obj_get_scroll_left(obj);
    lv_coord_t y_ofs = obj->coords.y1 + pad_top - lv_obj_get_scroll_top(obj);
    lv_chart_series_t * ser;

    lv_area_t series_clip_area;
    bool mask_ret = _lv_area_intersect(&series_clip_area, &obj->coords, draw_ctx->clip_area);
    if(mask_ret == false) return;

    lv_draw_line_dsc_t line_dsc_default;
    lv_draw_line_dsc_init(&line_dsc_default);
    lv_obj_init_draw_line_dsc(obj, LV_PART_ITEMS, &line_dsc_default);

    lv_draw_rect_dsc_t point_dsc_default;
    lv_draw_rect_dsc_init(&point_dsc_default);
    lv_obj_init_draw_rect_dsc(obj, LV_PART_INDICATOR, &point_dsc_default);

    lv_coord_t point_w = lv_obj_get_style_width(obj, LV_PART_INDICATOR) / 2;
    lv_coord_t point_h = lv_obj_get_style_height(obj, LV_PART_INDICATOR) / 2;

    /*Do not bother with line ending is the point will over it*/
    if(LV_MIN(point_w, point_h) > line_dsc_default.width / 2) line_dsc_default.raw_end = 1;
    if(line_dsc_default.width == 1) line_dsc_default.raw_end = 1;

    /*If there are at least as much points as pixels then draw only vertical lines*/
    bool crowded_mode = chart->point_cnt >= w ? true : false;

    /*Go through all data lines*/
    _LV_LL_READ_BACK(&chart->series_ll, ser) {
        if(ser->hidden) continue;
        line_dsc_default.color = ser->color;
        point_dsc_default.bg_color = ser->color;

        lv_coord_t start_point = lv_chart_get_x_start_point(obj, ser);

        p1.x = x_ofs;
        p2.x = x_ofs;

        lv_coord_t p_act = start_point;
        lv_coord_t p_prev = start_point;
        int32_t y_tmp = (int32_t)((int32_t)ser->y_points[p_prev] - chart->ymin[ser->y_axis_sec]) * h;
        y_tmp  = y_tmp / (chart->ymax[ser->y_axis_sec] - chart->ymin[ser->y_axis_sec]);
        p2.y   = h - y_tmp + y_ofs;

        lv_obj_draw_part_dsc_t part_draw_dsc;
        lv_obj_draw_dsc_init(&part_draw_dsc, draw_ctx);
        part_draw_dsc.class_p = MY_CLASS;
        part_draw_dsc.type = LV_CHART_DRAW_PART_LINE_AND_POINT;
        part_draw_dsc.part = LV_PART_ITEMS;
        part_draw_dsc.line_dsc = &line_dsc_default;
        part_draw_dsc.rect_dsc = &point_dsc_default;
        part_draw_dsc.sub_part_ptr = ser;

        lv_coord_t y_min = p2.y;
        lv_coord_t y_max = p2.y;
        lv_coord_t is_none_point = 0;
        for (i = 0; i < chart->point_cnt; i++) {
            p1.x = p2.x;
            p1.y = p2.y;

            if (p1.x > clip_area_ori->x2 + point_w + 1) break;
            p2.x = ((w * i) / (chart->point_cnt - 1)) + x_ofs;

            p_act = (start_point + i) % chart->point_cnt;

            y_tmp = (int32_t)((int32_t)ser->y_points[p_act] - chart->ymin[ser->y_axis_sec]) * h;
            y_tmp = y_tmp / (chart->ymax[ser->y_axis_sec] - chart->ymin[ser->y_axis_sec]);
            p2.y = h - y_tmp + y_ofs;

            if (p2.x < clip_area_ori->x1 - point_w - 1) {
                p_prev = p_act;
                continue;
            }

            /*Don't draw the first point. A second point is also required to draw the line*/
            if (i != 0) {
                if (crowded_mode) {
                    if (ser->y_points[p_prev] != LV_CHART_POINT_NONE && ser->y_points[p_act] != LV_CHART_POINT_NONE) {
                        /*Draw only one vertical line between the min and max y-values on the same x-value*/
                        y_max = LV_MAX(y_max, p2.y);
                        y_min = LV_MIN(y_min, p2.y);
                        if (p1.x != p2.x) {
                            lv_coord_t y_cur = p2.y;
                            p2.x--;         /*It's already on the next x value*/
                            p1.x = p2.x;
                            p1.y = y_min;
                            p2.y = y_max;
                            if (p1.y == p2.y) p2.y++;    /*If they are the same no line will be drawn*/
                            if (!is_none_point)
                            {
                                lv_draw_line(draw_ctx, &line_dsc_default, &p1, &p2);
                            }
                            else
                            {
                                is_none_point = 0;
                            }
                            p2.x++;         /*Compensate the previous x--*/
                            y_min = y_cur;  /*Start the line of the next x from the current last y*/
                            y_max = y_cur;
                        }
                    }
                    else
                    {
                        is_none_point = 1;
                    }
                }
                else {
                    lv_area_t point_area;
                    point_area.x1 = p1.x - point_w;
                    point_area.x2 = p1.x + point_w;
                    point_area.y1 = p1.y - point_h;
                    point_area.y2 = p1.y + point_h;

                    part_draw_dsc.id = i - 1;
                    part_draw_dsc.p1 = ser->y_points[p_prev] != LV_CHART_POINT_NONE ? &p1 : NULL;
                    part_draw_dsc.p2 = ser->y_points[p_act] != LV_CHART_POINT_NONE ? &p2 : NULL;
                    part_draw_dsc.draw_area = &point_area;
                    part_draw_dsc.value = ser->y_points[p_prev];

                    lv_event_send(obj, LV_EVENT_DRAW_PART_BEGIN, &part_draw_dsc);

                    if(ser->y_points[p_prev] != LV_CHART_POINT_NONE && ser->y_points[p_act] != LV_CHART_POINT_NONE) {
                        lv_draw_line(draw_ctx, &line_dsc_default, &p1, &p2);
                    }

                    if(point_w && point_h && ser->y_points[p_prev] != LV_CHART_POINT_NONE) {
                        lv_draw_rect(draw_ctx, &point_dsc_default, &point_area);
                    }

                    lv_event_send(obj, LV_EVENT_DRAW_PART_END, &part_draw_dsc);
                }

            }
            p_prev = p_act;
        }

        /*Draw the last point*/
        if(!crowded_mode && i == chart->point_cnt) {

            if(ser->y_points[p_act] != LV_CHART_POINT_NONE) {
                lv_area_t point_area;
                point_area.x1 = p2.x - point_w;
                point_area.x2 = p2.x + point_w;
                point_area.y1 = p2.y - point_h;
                point_area.y2 = p2.y + point_h;

                part_draw_dsc.id = i - 1;
                part_draw_dsc.p1 = NULL;
                part_draw_dsc.p2 = NULL;
                part_draw_dsc.draw_area = &point_area;
                part_draw_dsc.value = ser->y_points[p_act];

                lv_event_send(obj, LV_EVENT_DRAW_PART_BEGIN, &part_draw_dsc);
                lv_draw_rect(draw_ctx, &point_dsc_default, &point_area);
                lv_event_send(obj, LV_EVENT_DRAW_PART_END, &part_draw_dsc);
            }
        }
    }

    draw_ctx->clip_area = clip_area_ori;
}
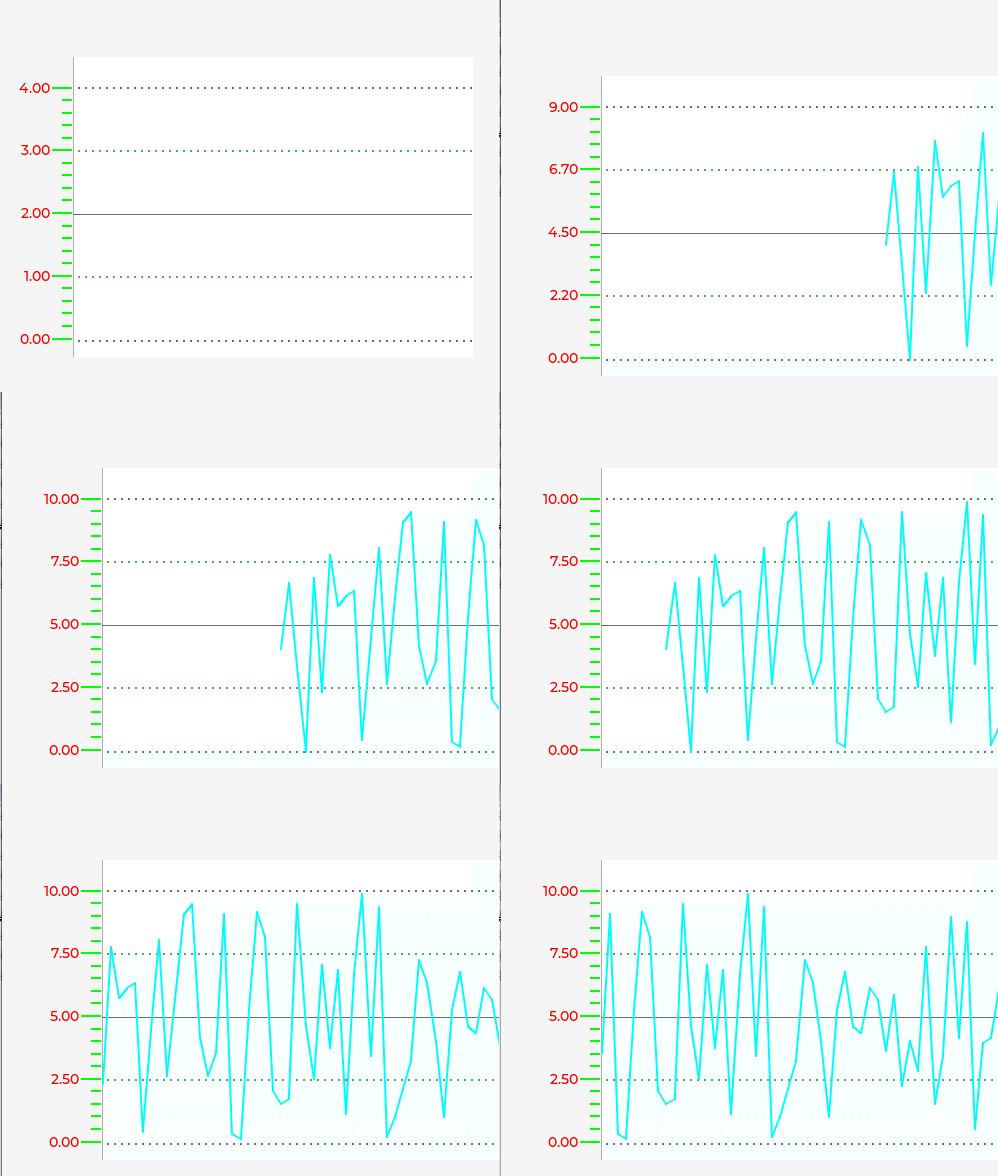
显示实时曲线
一直左移刷新
static lv_obj_t* chart;
#define CHART_DATA_SIZE   (100)
/**
 * @brief chart 坐标网格线绘制
 * @param e
*/
static void draw_event_cb(lv_event_t* e)
{
    lv_obj_t* obj = lv_event_get_target(e);

    /*Add the faded area before the lines are drawn*/
    lv_obj_draw_part_dsc_t* dsc = lv_event_get_draw_part_dsc(e);
    if (dsc->part == LV_PART_MAIN) {
        if (dsc->line_dsc == NULL || dsc->p1 == NULL || dsc->p2 == NULL) return;

        /* 网格线 竖线 */
        if (dsc->p1->x == dsc->p2->x) {
            //dsc->line_dsc->color = lv_palette_lighten(LV_PALETTE_GREY, 1);
            //if (dsc->id == 1) {
            //    dsc->line_dsc->width = 0;
            //    dsc->line_dsc->dash_gap = 0;
            //    dsc->line_dsc->dash_width = 0;
            //}
            //else {
            //    dsc->line_dsc->width = 1;
            //    dsc->line_dsc->dash_gap = 6;
            //    dsc->line_dsc->dash_width = 6;
            //}
        }
        /* 网格线 横线 */
        else {
            if (dsc->id == 2 ) {
                /* 第二条线 宽度为1 实线 */
                dsc->line_dsc->width = 1;
                dsc->line_dsc->dash_gap = 0;
                dsc->line_dsc->dash_width = 0;
            }
            else {
                /* 其他线 宽度为2 虚线 */
                dsc->line_dsc->width = 2;
                dsc->line_dsc->dash_gap = 6;
                dsc->line_dsc->dash_width = 1;
            }

            if (dsc->id == 1 || dsc->id == 3) {
                /* 第1、2条线 颜色为绿色 */
                dsc->line_dsc->color = lv_palette_main(LV_PALETTE_GREEN);
            }
            else {
                dsc->line_dsc->color = lv_color_hex(0x6f6f6f);
            }
        }
    }
}

static void draw_label_event_cb(lv_event_t* e)
{
    lv_obj_draw_part_dsc_t* dsc = lv_event_get_draw_part_dsc(e);
    if (!lv_obj_draw_part_check_type(dsc, &lv_chart_class, LV_CHART_DRAW_PART_TICK_LABEL)) return;

    if (dsc->id == LV_CHART_AXIS_PRIMARY_Y && dsc->text) {
        lv_snprintf(dsc->text, dsc->text_length, "%.2f", dsc->value/10.0f); //dsc->value 是实际标签的数值
    }
}


#if 0
extern void lv_chart_set_next_value3(lv_obj_t* obj, lv_chart_series_t* ser, lv_coord_t value);
void chart_add_data(int16_t data)
{
    static int cnt = 0;
    static int16_t max = 0;
    static int16_t min = 0;
    lv_chart_series_t* series = lv_chart_get_series_next(chart, NULL);

    lv_chart_set_next_value3(chart, series, data);
    {
        /* 获取数据点最大值 */
        lv_coord_t* array = lv_chart_get_y_array(chart, series);
        max = data;
        min = data;
        for (int i = 0; i < CHART_DATA_SIZE; i++)
        {
            if (array[i] > max && array[i] != LV_CHART_POINT_NONE)
            {
                max = array[i];
            }

            if (array[i] < min && array[i] != LV_CHART_POINT_NONE)
            {
                min = array[i];
            }
        }

        /* 如果输入范围超出y轴 则修改y轴 */
        if ((min < ((lv_chart_t*)chart)->ymin[0]) || (max > ((lv_chart_t*)chart)->ymax[0]))
        {
            lv_chart_set_range(chart, LV_CHART_AXIS_PRIMARY_Y, (min - 9) / 10 * 10, (max + 9) / 10 * 10);
        }
    }
}
#else
void chart_add_data(int16_t data)
{
    static int cnt = 0;
    static int16_t max = 0;
    static int16_t min = 0;
    lv_chart_series_t* series = lv_chart_get_series_next(chart, NULL);
    lv_chart_set_next_value(chart, series, data);

    {
        /* 先从左向右绘制 绘制到最右侧后改为平移模式 */
        if (cnt++ == CHART_DATA_SIZE)
        {
            lv_chart_set_update_mode(chart, LV_CHART_UPDATE_MODE_SHIFT);
        }

        /* 获取数据点最大值 最小值 */
        lv_coord_t* array = lv_chart_get_y_array(chart, series);
        max = data;
        min = data;
        for (int i = 0; i < CHART_DATA_SIZE; i++)
        {
            if (array[i] > max && array[i] != LV_CHART_POINT_NONE)
            {
                max = array[i];
            }

            if (array[i] <  min && array[i] != LV_CHART_POINT_NONE)
            {
                min = array[i];
            }
        }

        /* 如果输入范围超出y轴 则修改y轴 */
        if ((min < ((lv_chart_t*)chart)->ymin[0]) || (max > ((lv_chart_t*)chart)->ymax[0]))
        {
            lv_chart_set_range(chart, LV_CHART_AXIS_PRIMARY_Y, (min-9)/10*10, (max+9)/10*10);
        }
    }
}
#endif


static void timer_event_cb(lv_timer_t* t)
{
    chart_add_data(rand()%100);
}

static lv_obj_t* chart_test(void)
{

    lv_obj_t* screen = lv_obj_create(NULL);

    chart = lv_chart_create(screen);
    lv_obj_set_size(chart, 400, 300);
    lv_obj_set_pos(chart, 100, 100);
    lv_obj_set_style_radius(chart, 0, LV_PART_MAIN | LV_STATE_DEFAULT);
    lv_obj_set_style_border_width(chart, 1, LV_STATE_DEFAULT);
    lv_obj_set_style_border_side(chart, LV_BORDER_SIDE_LEFT, LV_STATE_DEFAULT);
    lv_obj_set_style_border_color(chart, lv_color_hex(0xafafaf), LV_STATE_DEFAULT);
    lv_obj_set_style_bg_color(chart, lv_color_hex(0xFFFFFF), 0);

    //设置网格线条数
    lv_chart_set_div_line_count(chart, 5, 0);

    //设置网格线离图表边缘的距离
    lv_obj_set_style_pad_all(chart, 0, LV_STATE_DEFAULT);
    lv_obj_set_style_pad_bottom(chart, 15, LV_STATE_DEFAULT);
    lv_obj_set_style_pad_top(chart, 30, LV_STATE_DEFAULT);

    //添加重绘回调函数
    lv_obj_add_event_cb(chart, draw_event_cb, LV_EVENT_DRAW_PART_BEGIN, NULL);

    //设置 PRIMARY_Y 轴范围 0-40
    lv_chart_set_range(chart, LV_CHART_AXIS_PRIMARY_Y, 0, 40);
    lv_chart_set_axis_tick(chart, LV_CHART_AXIS_PRIMARY_Y, 20, 10, 5, 5, true, 80);

    //设置标签文本颜色 和 字体
    lv_obj_set_style_text_color(chart, lv_color_hex(0xFF0000), LV_PART_TICKS);
    //lv_obj_set_style_text_font(chart, &lv_font_montserrat_24, LV_PART_TICKS);

    //设置刻度线颜色 和 宽度
    lv_obj_set_style_line_color(chart, lv_color_hex(0xFF00), LV_PART_TICKS);
    lv_obj_set_style_line_width(chart, 2, LV_PART_TICKS);

    //添加重绘回调函数
    lv_obj_add_event_cb(chart, draw_label_event_cb, LV_EVENT_DRAW_PART_BEGIN, NULL);

    //设置为折线图
    lv_chart_set_type(chart, LV_CHART_TYPE_LINE);

    //为 PRIMARY_Y 轴添加一条折线
    lv_obj_t* series = lv_chart_add_series(chart, lv_color_hex(0x00ffff), LV_CHART_AXIS_PRIMARY_Y);

    lv_chart_set_point_count(chart, CHART_DATA_SIZE);

    //设置线宽
    lv_obj_set_style_line_width(chart, 2, LV_PART_ITEMS);
    lv_obj_set_style_line_rounded(chart, 1, LV_PART_ITEMS);

    //不显示数据点
    lv_obj_set_style_size(chart, 0, LV_PART_INDICATOR);

    //循环模式
    lv_chart_set_update_mode(chart, LV_CHART_UPDATE_MODE_CIRCULAR);

    //创建定时器
    lv_timer_create(timer_event_cb, 100, NULL);

    return screen;
}
循环刷新
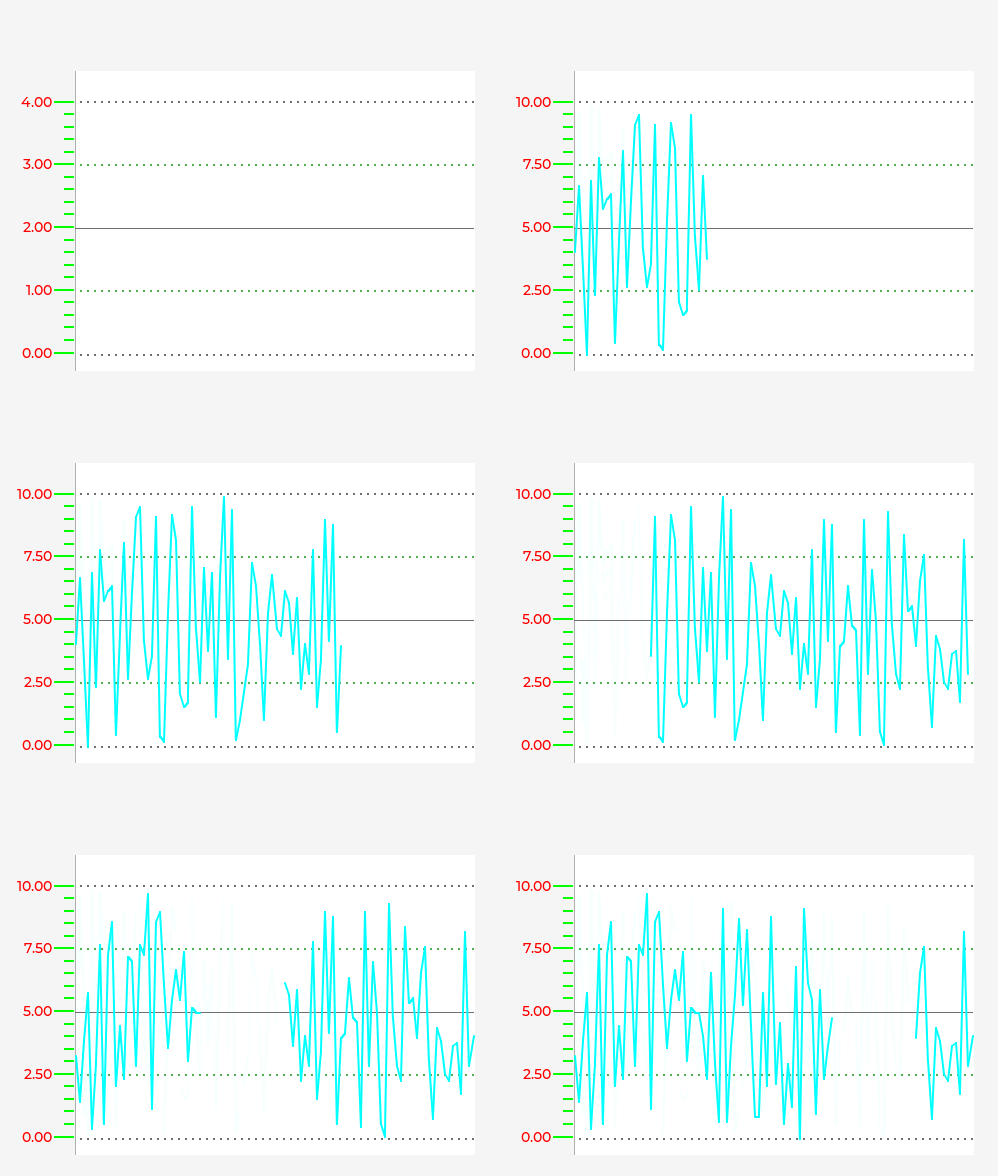
需要在 lv_chart.c中添加一个自定义函数
void lv_chart_set_next_value3(lv_obj_t* obj, lv_chart_series_t* ser, lv_coord_t value)
{
    LV_ASSERT_OBJ(obj, MY_CLASS);
    LV_ASSERT_NULL(ser);

    lv_chart_t* chart = (lv_chart_t*)obj;
    ser->y_points[ser->start_point] = value;
    invalidate_point(obj, ser->start_point);
    ser->start_point = (ser->start_point + 1) % chart->point_cnt;

    lv_coord_t index = ser->start_point;
    for (int i = 0; i < 20; i++)
    {
        ser->y_points[index] = LV_CHART_POINT_NONE;
        invalidate_point(obj, index);
        index = (index + 1) % chart->point_cnt;
    }
}
static lv_obj_t* chart;
#define CHART_DATA_SIZE   (100)
/**
 * @brief chart 坐标网格线绘制
 * @param e
*/
static void draw_event_cb(lv_event_t* e)
{
    lv_obj_t* obj = lv_event_get_target(e);

    /*Add the faded area before the lines are drawn*/
    lv_obj_draw_part_dsc_t* dsc = lv_event_get_draw_part_dsc(e);
    if (dsc->part == LV_PART_MAIN) {
        if (dsc->line_dsc == NULL || dsc->p1 == NULL || dsc->p2 == NULL) return;

        /* 网格线 竖线 */
        if (dsc->p1->x == dsc->p2->x) {
            //dsc->line_dsc->color = lv_palette_lighten(LV_PALETTE_GREY, 1);
            //if (dsc->id == 1) {
            //    dsc->line_dsc->width = 0;
            //    dsc->line_dsc->dash_gap = 0;
            //    dsc->line_dsc->dash_width = 0;
            //}
            //else {
            //    dsc->line_dsc->width = 1;
            //    dsc->line_dsc->dash_gap = 6;
            //    dsc->line_dsc->dash_width = 6;
            //}
        }
        /* 网格线 横线 */
        else {
            if (dsc->id == 2 ) {
                /* 第二条线 宽度为1 实线 */
                dsc->line_dsc->width = 1;
                dsc->line_dsc->dash_gap = 0;
                dsc->line_dsc->dash_width = 0;
            }
            else {
                /* 其他线 宽度为2 虚线 */
                dsc->line_dsc->width = 2;
                dsc->line_dsc->dash_gap = 6;
                dsc->line_dsc->dash_width = 1;
            }

            if (dsc->id == 1 || dsc->id == 3) {
                /* 第1、2条线 颜色为绿色 */
                dsc->line_dsc->color = lv_palette_main(LV_PALETTE_GREEN);
            }
            else {
                dsc->line_dsc->color = lv_color_hex(0x6f6f6f);
            }
        }
    }
}

static void draw_label_event_cb(lv_event_t* e)
{
    lv_obj_draw_part_dsc_t* dsc = lv_event_get_draw_part_dsc(e);
    if (!lv_obj_draw_part_check_type(dsc, &lv_chart_class, LV_CHART_DRAW_PART_TICK_LABEL)) return;

    if (dsc->id == LV_CHART_AXIS_PRIMARY_Y && dsc->text) {
        lv_snprintf(dsc->text, dsc->text_length, "%.2f", dsc->value/10.0f); //dsc->value 是实际标签的数值
    }
}


#if 1
extern void lv_chart_set_next_value3(lv_obj_t* obj, lv_chart_series_t* ser, lv_coord_t value);
void chart_add_data(int16_t data)
{
    static int cnt = 0;
    static int16_t max = 0;
    static int16_t min = 0;
    lv_chart_series_t* series = lv_chart_get_series_next(chart, NULL);

    lv_chart_set_next_value3(chart, series, data);
    {
        /* 获取数据点最大值 */
        lv_coord_t* array = lv_chart_get_y_array(chart, series);
        max = data;
        min = data;
        for (int i = 0; i < CHART_DATA_SIZE; i++)
        {
            if (array[i] > max && array[i] != LV_CHART_POINT_NONE)
            {
                max = array[i];
            }

            if (array[i] < min && array[i] != LV_CHART_POINT_NONE)
            {
                min = array[i];
            }
        }

        /* 如果输入范围超出y轴 则修改y轴 */
        if ((min < ((lv_chart_t*)chart)->ymin[0]) || (max > ((lv_chart_t*)chart)->ymax[0]))
        {
            lv_chart_set_range(chart, LV_CHART_AXIS_PRIMARY_Y, (min - 9) / 10 * 10, (max + 9) / 10 * 10);
        }
    }
}
#else
void chart_add_data(int16_t data)
{
    static int cnt = 0;
    static int16_t max = 0;
    static int16_t min = 0;
    lv_chart_series_t* series = lv_chart_get_series_next(chart, NULL);
    lv_chart_set_next_value(chart, series, data);

    {
        /* 先从左向右绘制 绘制到最右侧后改为平移模式 */
        if (cnt++ == CHART_DATA_SIZE)
        {
            lv_chart_set_update_mode(chart, LV_CHART_UPDATE_MODE_SHIFT);
        }

        /* 获取数据点最大值 最小值 */
        lv_coord_t* array = lv_chart_get_y_array(chart, series);
        max = data;
        min = data;
        for (int i = 0; i < CHART_DATA_SIZE; i++)
        {
            if (array[i] > max && array[i] != LV_CHART_POINT_NONE)
            {
                max = array[i];
            }

            if (array[i] <  min && array[i] != LV_CHART_POINT_NONE)
            {
                min = array[i];
            }
        }

        /* 如果输入范围超出y轴 则修改y轴 */
        if ((min < ((lv_chart_t*)chart)->ymin[0]) || (max > ((lv_chart_t*)chart)->ymax[0]))
        {
            lv_chart_set_range(chart, LV_CHART_AXIS_PRIMARY_Y, (min-9)/10*10, (max+9)/10*10);
        }
    }
}
#endif


static void timer_event_cb(lv_timer_t* t)
{
    chart_add_data(rand()%100);
}

static lv_obj_t* chart_test(void)
{

    lv_obj_t* screen = lv_obj_create(NULL);

    chart = lv_chart_create(screen);
    lv_obj_set_size(chart, 400, 300);
    lv_obj_set_pos(chart, 100, 100);
    lv_obj_set_style_radius(chart, 0, LV_PART_MAIN | LV_STATE_DEFAULT);
    lv_obj_set_style_border_width(chart, 1, LV_STATE_DEFAULT);
    lv_obj_set_style_border_side(chart, LV_BORDER_SIDE_LEFT, LV_STATE_DEFAULT);
    lv_obj_set_style_border_color(chart, lv_color_hex(0xafafaf), LV_STATE_DEFAULT);
    lv_obj_set_style_bg_color(chart, lv_color_hex(0xFFFFFF), 0);

    //设置网格线条数
    lv_chart_set_div_line_count(chart, 5, 0);

    //设置网格线离图表边缘的距离
    lv_obj_set_style_pad_all(chart, 0, LV_STATE_DEFAULT);
    lv_obj_set_style_pad_bottom(chart, 15, LV_STATE_DEFAULT);
    lv_obj_set_style_pad_top(chart, 30, LV_STATE_DEFAULT);

    //添加重绘回调函数
    lv_obj_add_event_cb(chart, draw_event_cb, LV_EVENT_DRAW_PART_BEGIN, NULL);

    //设置 PRIMARY_Y 轴范围 0-40
    lv_chart_set_range(chart, LV_CHART_AXIS_PRIMARY_Y, 0, 40);
    lv_chart_set_axis_tick(chart, LV_CHART_AXIS_PRIMARY_Y, 20, 10, 5, 5, true, 80);

    //设置标签文本颜色 和 字体
    lv_obj_set_style_text_color(chart, lv_color_hex(0xFF0000), LV_PART_TICKS);
    //lv_obj_set_style_text_font(chart, &lv_font_montserrat_24, LV_PART_TICKS);

    //设置刻度线颜色 和 宽度
    lv_obj_set_style_line_color(chart, lv_color_hex(0xFF00), LV_PART_TICKS);
    lv_obj_set_style_line_width(chart, 2, LV_PART_TICKS);

    //添加重绘回调函数
    lv_obj_add_event_cb(chart, draw_label_event_cb, LV_EVENT_DRAW_PART_BEGIN, NULL);

    //设置为折线图
    lv_chart_set_type(chart, LV_CHART_TYPE_LINE);

    //为 PRIMARY_Y 轴添加一条折线
    lv_obj_t* series = lv_chart_add_series(chart, lv_color_hex(0x00ffff), LV_CHART_AXIS_PRIMARY_Y);

    lv_chart_set_point_count(chart, CHART_DATA_SIZE);

    //设置线宽
    lv_obj_set_style_line_width(chart, 2, LV_PART_ITEMS);
    lv_obj_set_style_line_rounded(chart, 1, LV_PART_ITEMS);

    //不显示数据点
    lv_obj_set_style_size(chart, 0, LV_PART_INDICATOR);

    //循环模式
    lv_chart_set_update_mode(chart, LV_CHART_UPDATE_MODE_CIRCULAR);

    //创建定时器
    lv_timer_create(timer_event_cb, 100, NULL);

    return screen;
}
文章来源:https://blog.csdn.net/weixin_42378319/article/details/135225989
本文来自互联网用户投稿,该文观点仅代表作者本人,不代表本站立场。本站仅提供信息存储空间服务,不拥有所有权,不承担相关法律责任。 如若内容造成侵权/违法违规/事实不符,请联系我的编程经验分享网邮箱:chenni525@qq.com进行投诉反馈,一经查实,立即删除!
本文来自互联网用户投稿,该文观点仅代表作者本人,不代表本站立场。本站仅提供信息存储空间服务,不拥有所有权,不承担相关法律责任。 如若内容造成侵权/违法违规/事实不符,请联系我的编程经验分享网邮箱:chenni525@qq.com进行投诉反馈,一经查实,立即删除!
最新文章
- Python教程
- 深入理解 MySQL 中的 HAVING 关键字和聚合函数
- Qt之QChar编码(1)
- MyBatis入门基础篇
- 用Python脚本实现FFmpeg批量转换
- windows10上比较好用的截图软件
- POSIX API与网络协议栈
- 探索设计模式的魅力:一次设计,多次利用,深入理解原型模式的设计艺术
- Redis设计与实现之事件
- 代码随想录训练营第二十七天打卡|39. 组合总和 40.组合总和II 131.分割回文串
- 网工每日一练(1月24日)
- 5-sql注入之文件读写
- Flink电商实时数仓项目部署上线
- MyBatis-Plus 基础:LambdaQueryWrapper详解与实例
- (十)上市企业实施IPD成功案例分享之——IBM