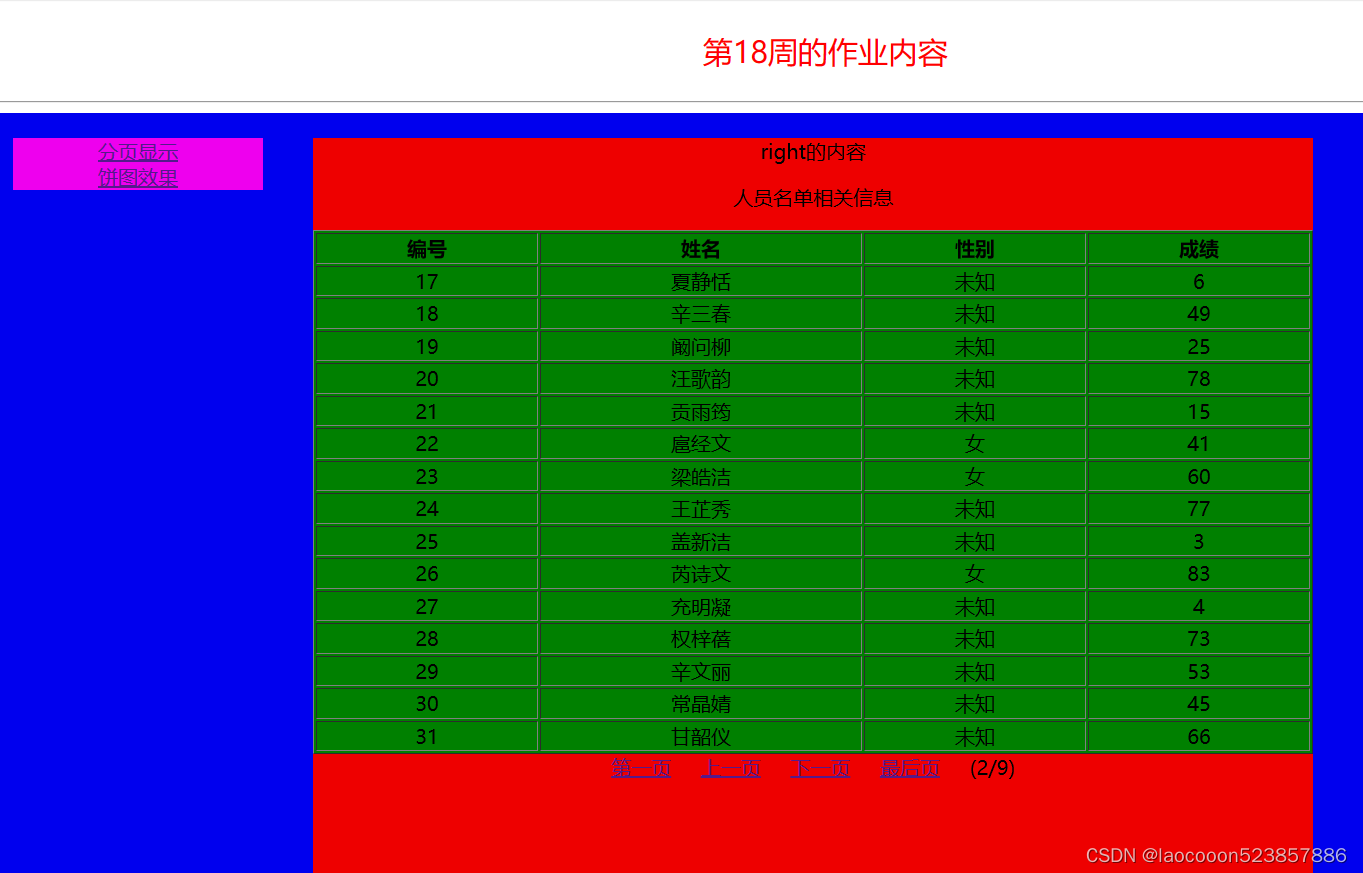
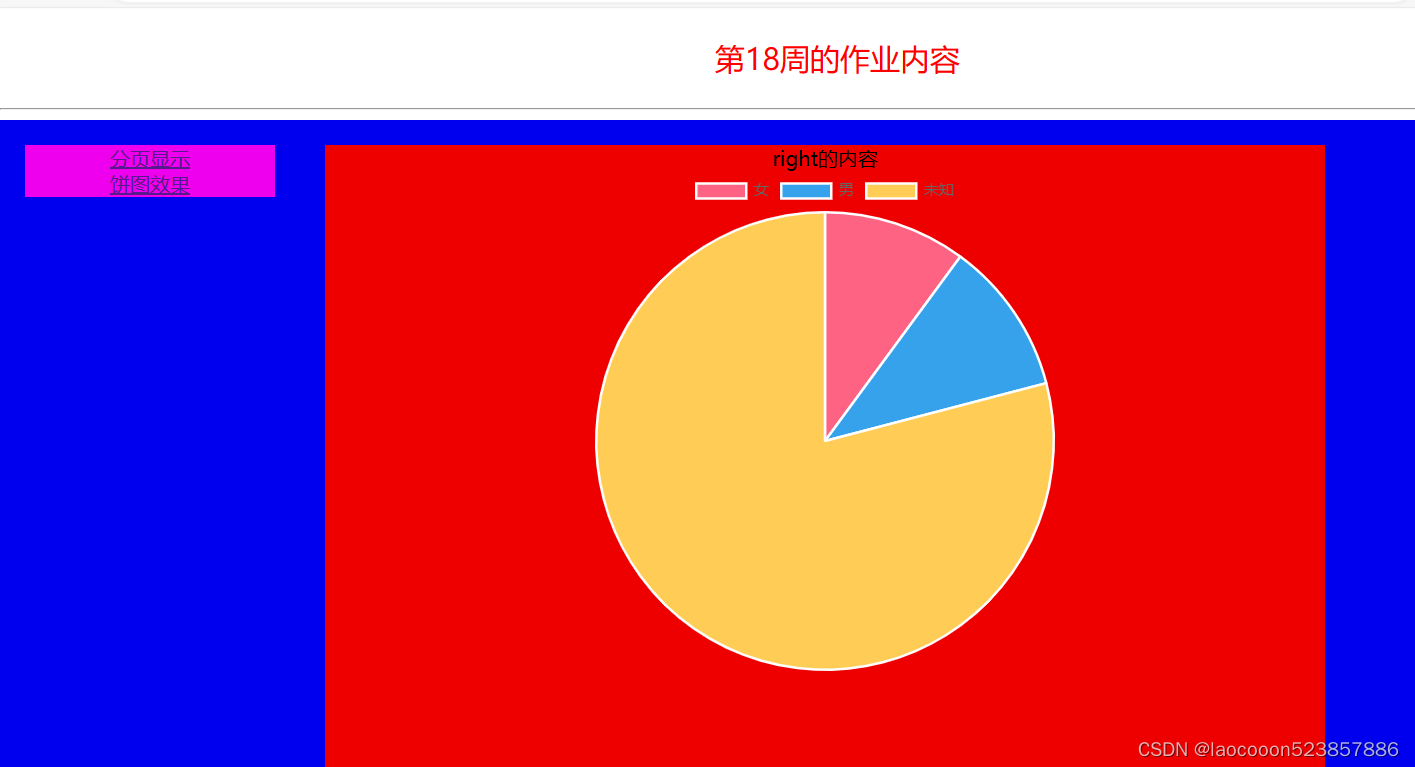
根据前一篇文章处理界面显示效果
发布时间:2023年12月18日
<%@ page language="java" contentType="text/html; charset=UTF-8"
pageEncoding="UTF-8"%>
<!DOCTYPE html>
<html>
<head>
<meta charset="UTF-8">
<title>Insert title here</title>
<style type="text/css">
.cp1{
text-align: center;
color:red;
font-size:24px;
}
.main{
width:100%;
height:700px;
background: #0000ee;
}
.left{
width:200px;
background-color: #ee00ee;
text-align: center;
margin: 20px;
float:left;
}
.right{
width:800px;
height:600px;
background-color: #ee0000;
text-align: center;
margin: 20px;
float:left;
}
</style>
</head>
<body>
<p class="cp1">
第18周的作业内容
</p>
<hr>
<div class="main">
<div class="left">
<a href="one.jsp">分页显示</a><br>
<a href="two.jsp">饼图效果</a>
</div>
<div class="right">
right的内容
</div>
</div>
</body>
</html>
<%@page import="java.util.Map.Entry"%>
<%@page import="week18.util.PageUtil"%>
<%@page import="week18.biz.StuBizImpl"%>
<%@page import="week18.entity.*"%>
<%@page import="java.util.*"%>
<%@ page language="java" contentType="text/html; charset=UTF-8"
pageEncoding="UTF-8"%>
<%
String page1=request.getParameter("page");
int pageNum = 1;
if(page1==null)
pageNum = 1;
else
pageNum = Integer.parseInt(page1);
StuBizImpl sbi= new StuBizImpl();
int pageSize=15;
int currIndex =pageNum;
int totalCount=sbi.SelectCount();
PageUtil pageUtil = new PageUtil( pageSize, currIndex, totalCount);
List<Stu> list=sbi.SelectByPage(pageUtil.getStart(), pageUtil.getPageSize());
%>
<!DOCTYPE html>
<html>
<head>
<meta charset="UTF-8">
<title>Insert title here</title>
<style type="text/css">
.cp1{
text-align: center;
color:red;
font-size:24px;
}
.left{
width:200px;
background-color: #ee00ee;
text-align: center;
margin: 20px;
float:left;
}
.right{
width:800px;
height:600px;
background-color: #ee0000;
text-align: center;
margin: 20px;
float:left;
}
table{
width:100%;
background-color: green;
text-align: center;
}
.main{
width:100%;
height:700px;
background: #0000ee;
}
</style>
</head>
<body>
<p class="cp1">
第18周的作业内容
</p>
<hr>
<div class="main">
<div class="left">
<a href="one.jsp">分页显示</a><br>
<a href="two.jsp">饼图效果</a>
</div>
<div class="right">
right的内容
<p></p>
<p></p>
<p></p>
<p></p>
<p>人员名单相关信息</p>
<table border="1">
<tr>
<th>编号</th>
<th>姓名</th>
<th>性别</th>
<th>成绩</th>
</tr>
<%for(Stu stu:list) {%>
<tr>
<td><%=stu.getId() %></td>
<td><%=stu.getName() %></td>
<td><%=stu.getSex() %></td>
<td><%=stu.getScore() %></td>
</tr>
<%} %>
</table>
<div class="d1">
<a href="one.jsp?page=1">第一页</a>
<a href="one.jsp?page=<%=pageUtil.getCurrIndex()-1%>">上一页</a>
<a href="one.jsp?page=<%=pageUtil.getCurrIndex()+1%>">下一页</a>
<a href="one.jsp?page=<%=pageUtil.getTotalPage()%>">最后页</a>
(<%=pageUtil.getCurrIndex() %>/<%=pageUtil.getTotalPage() %>)
</div>
</div>
</div>
</body>
</html>
<%@page import="java.util.Map.Entry"%>
<%@page import="week18.util.PageUtil"%>
<%@page import="week18.biz.StuBizImpl"%>
<%@page import="week18.entity.*"%>
<%@page import="java.util.*"%>
<%@ page language="java" contentType="text/html; charset=UTF-8"
pageEncoding="UTF-8"%>
<%
StuBizImpl sbi= new StuBizImpl();
Map<String,Integer> map=sbi.SexConut();
String keyStr="",valStr="";
for(Entry<String,Integer> entry:map.entrySet()){
String key=entry.getKey();
Integer value=entry.getValue();
keyStr+="'"+key+"',";
valStr+=value+",";
}
%>
<!DOCTYPE html>
<html>
<head>
<meta charset="UTF-8">
<title>Insert title here</title>
<script src="https://cdn.staticfile.org/Chart.js/3.9.1/chart.js"></script>
<style type="text/css">
.cp1{
text-align: center;
color:red;
font-size:24px;
}
.main{
width:100%;
height:700px;
background: #0000ee;
}
.left{
width:200px;
background-color: #ee00ee;
text-align: center;
margin: 20px;
float:left;
}
.right{
width:800px;
height:600px;
background-color: #ee0000;
text-align: center;
margin: 20px;
float:left;
}
</style>
</head>
<body>
<p class="cp1">
第18周的作业内容
</p>
<hr>
<div class="main">
<div class="left">
<a href="one.jsp">分页显示</a><br>
<a href="two.jsp">饼图效果</a>
</div>
<div class="right">
right的内容
<div>
<canvas id="myChart" width="400" height="400"></canvas>
</div>
</div>
</div>
<script>
const ctx = document.getElementById('myChart');
const data = {
labels: [
<%=keyStr%>
],
datasets: [{
label: '不同性别占比情况',
data: [<%=valStr%>],
backgroundColor: [
'rgb(255, 99, 132)',
'rgb(54, 162, 235)',
'rgb(255, 205, 86)'
],
hoverOffset: 4
}]
};
const config = {
type: 'pie',
data: data,
options: {
responsive: true, // 设置图表为响应式,根据屏幕窗口变化而变化
maintainAspectRatio: false,// 保持图表原有比例
scales: {
yAxes: [{
ticks: {
beginAtZero:true
}
}]
}
}
};
const myChart = new Chart(ctx, config);
</script>
</body>
</html>
文章来源:https://blog.csdn.net/laocooon/article/details/135032052
本文来自互联网用户投稿,该文观点仅代表作者本人,不代表本站立场。本站仅提供信息存储空间服务,不拥有所有权,不承担相关法律责任。 如若内容造成侵权/违法违规/事实不符,请联系我的编程经验分享网邮箱:chenni525@qq.com进行投诉反馈,一经查实,立即删除!
本文来自互联网用户投稿,该文观点仅代表作者本人,不代表本站立场。本站仅提供信息存储空间服务,不拥有所有权,不承担相关法律责任。 如若内容造成侵权/违法违规/事实不符,请联系我的编程经验分享网邮箱:chenni525@qq.com进行投诉反馈,一经查实,立即删除!

