echarts折线面积图
发布时间:2024年01月10日
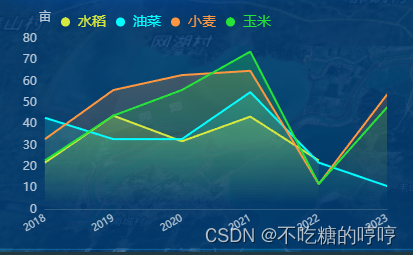
firstArr:[22,44,32,43.55,23],
secondArr:[43,33,33,55,22,11],
thirdArr:[33,56,63,65,12,54],
fourthArr:[23,44,56,74,12,48],
const options = {
  tooltip: {
    trigger: 'axis',
    axisPointer: {},
  },
  grid: {
    top: '20%',
    bottom: '10%',
    left:'10%',
    right:'2%'
  },
  legend:{
    icon: 'circle',
    itemHeight:9,//改变圆圈大小
    textStyle:{
      fontSize:14,
      color:['#d7e83f','#01ffff','#ff9640','#26e33a'],
      padding:[0,3 ,0 ,-5]
    },
    left:50,
    top:20,
  },
  xAxis: [
  ],
  yAxis: [
  ],
  series: [
    {
    },{
    },{
    },{
      name: '玉米',
      type: 'line',
      itemStyle: {
        color: '#26e33a',
      },
      showSymbol: false,
      areaStyle: {
        opacity: 0.8,
        color: new echarts.graphic.LinearGradient(0, 0, 0, 1, [
          {
            offset: 0,
            color: 'rgba(33, 229, 58,0.3)',
          },
          {
            offset:0.95,
            color: 'rgba(33, 229, 58,0)',
          },
        ]),
      },
      emphasis: {
        focus: 'series',
      },
      data:_this.fourthArr,
    },
  ],
};
文章来源:https://blog.csdn.net/Y13349887034/article/details/135429383
本文来自互联网用户投稿,该文观点仅代表作者本人,不代表本站立场。本站仅提供信息存储空间服务,不拥有所有权,不承担相关法律责任。 如若内容造成侵权/违法违规/事实不符,请联系我的编程经验分享网邮箱:chenni525@qq.com进行投诉反馈,一经查实,立即删除!
本文来自互联网用户投稿,该文观点仅代表作者本人,不代表本站立场。本站仅提供信息存储空间服务,不拥有所有权,不承担相关法律责任。 如若内容造成侵权/违法违规/事实不符,请联系我的编程经验分享网邮箱:chenni525@qq.com进行投诉反馈,一经查实,立即删除!