1. MATLAB的Plot中的Legend设定为多行多列
发布时间:2024年01月24日
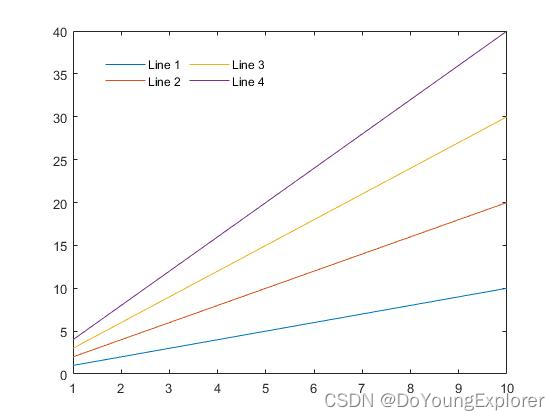
在MATLAB R0219中(低版本可能不适用),您可以使用legend函数来设置图例的位置和布局。要将图例标记变成2行2列的形式,您可以使用'NumColumns'参数设置列数。以下是一个示例
% 创建一些示例数据
x = 1:10;
y1 = x;
y2 = 2*x;
y3 = 3*x;
y4 = 4*x;

% 绘制四条曲线
plot(x, y1, 'DisplayName', 'Line 1');
hold on;
plot(x, y2, 'DisplayName', 'Line 2');
plot(x, y3, 'DisplayName', 'Line 3');
plot(x, y4, 'DisplayName', 'Line 4');

% 添加图例并设置列数为2
legend('NumColumns', 2);

% 可选:设置其他图例属性
legend('Location', 'Best'); % 设置图例位置为最佳位置
legend('boxoff'); % 关闭图例边框

在这个例子中,legend('NumColumns', 2)将图例标记设置为2行2列的形式。您可以根据需要调整数据和图例的位置。
文章来源:https://blog.csdn.net/u010489734/article/details/135787762
本文来自互联网用户投稿,该文观点仅代表作者本人,不代表本站立场。本站仅提供信息存储空间服务,不拥有所有权,不承担相关法律责任。 如若内容造成侵权/违法违规/事实不符,请联系我的编程经验分享网邮箱:chenni525@qq.com进行投诉反馈,一经查实,立即删除!
本文来自互联网用户投稿,该文观点仅代表作者本人,不代表本站立场。本站仅提供信息存储空间服务,不拥有所有权,不承担相关法律责任。 如若内容造成侵权/违法违规/事实不符,请联系我的编程经验分享网邮箱:chenni525@qq.com进行投诉反馈,一经查实,立即删除!
最新文章
- Python教程
- 深入理解 MySQL 中的 HAVING 关键字和聚合函数
- Qt之QChar编码(1)
- MyBatis入门基础篇
- 用Python脚本实现FFmpeg批量转换
- [HNCTF 2022 Week1]Interesting_http
- 公司防泄密软件监控员工哪些行为?
- 常用路径规划算法-Dijkstra、A*、D* 、RRT等
- 目标检测应用场景—数据集【NO.25】牛行为检测数据集
- Bug小能手系列(python)_14: pd.concat得到的矩阵错误
- 【每日试题】java面试之ssm框架
- 【计算机网络】序列化,反序列化和初识协议
- 基于Rocket MQ扩展的无限延迟消息队列
- 简洁大气带进度条的URL跳转页面HTML源码
- SAP BOM项目类别R简介