python【matplotlib】鼠标拖动滚动缩放坐标范围和拖动图例共存
发布时间:2023年12月19日
背景
根据前面的博文: python【matplotlib】画图鼠标缩放拖动动态改变坐标轴范围
和Python【Matplotlib】图例可拖动改变位置
两个博文,博主考虑了一下,如何将两者的功能结合起来,让二者共存。
只需根据Python【Matplotlib】鼠标单击事件判断点击的是否为图例
博文所说的,判断鼠标的单击坐标是否在图例所在的区域内,然后进行区分即可
效果

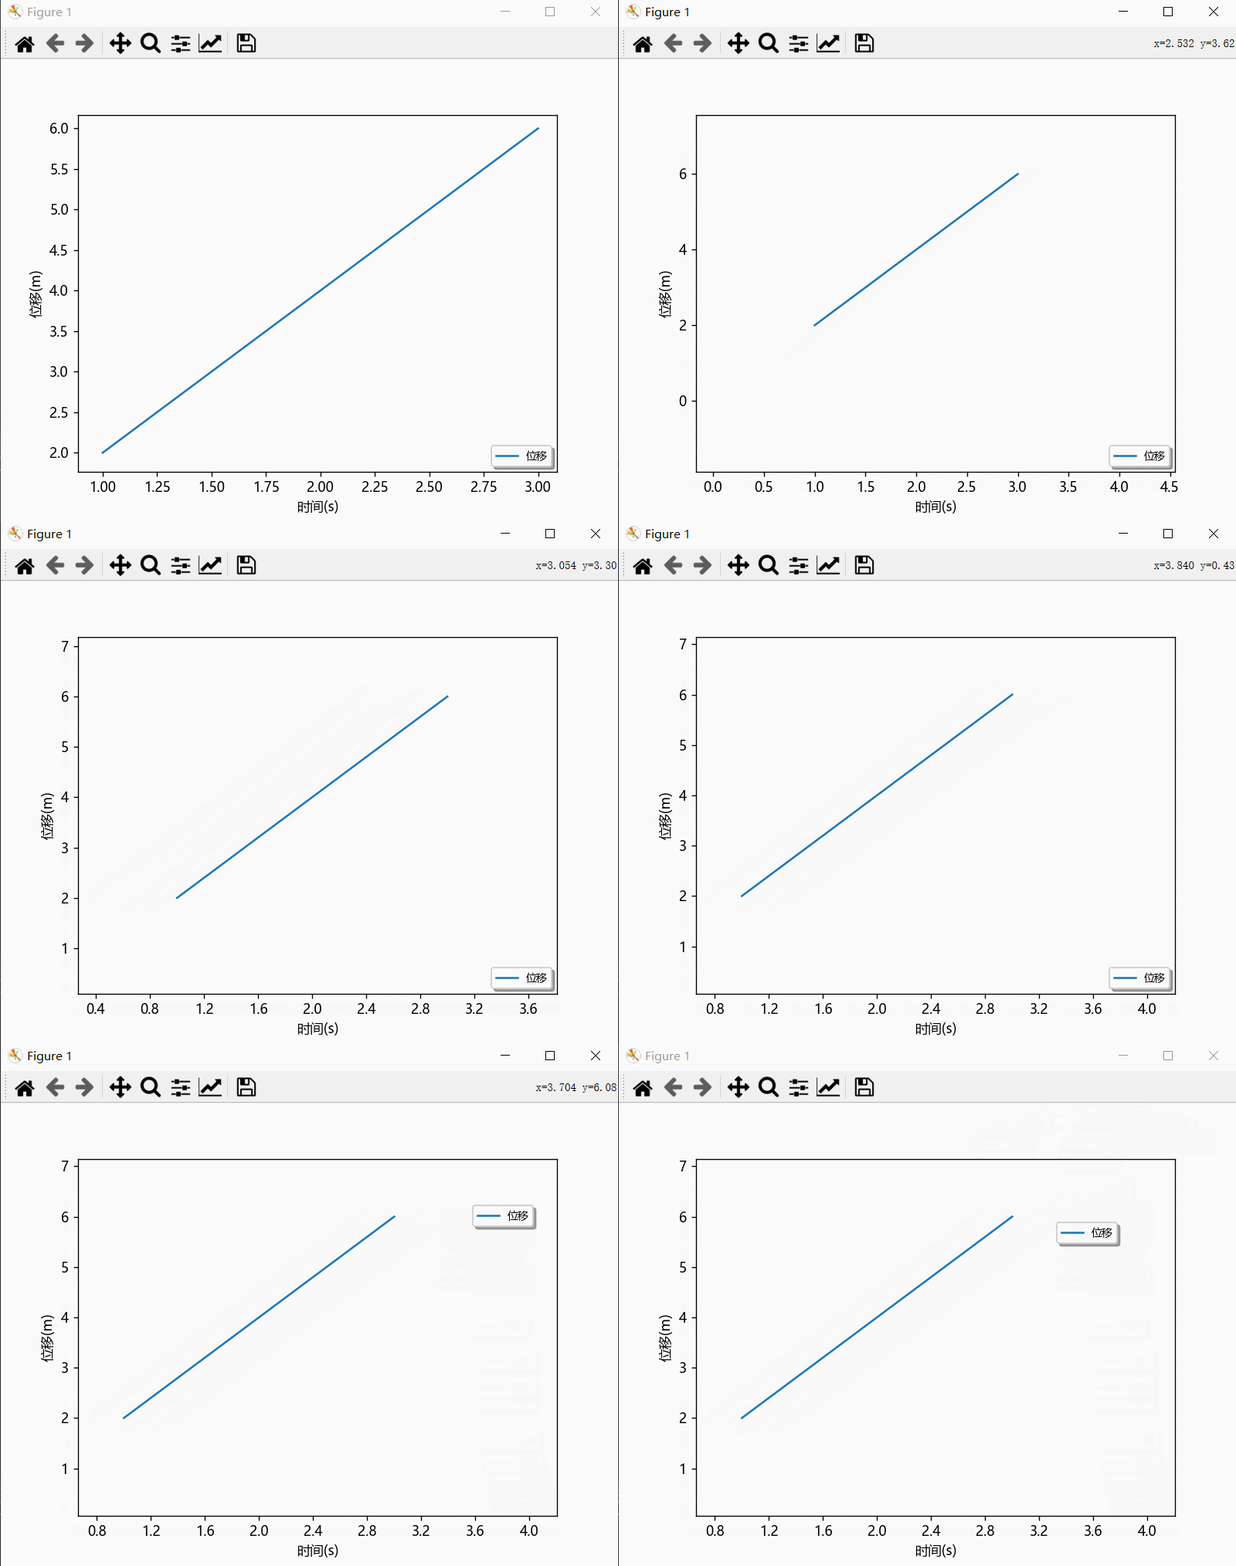
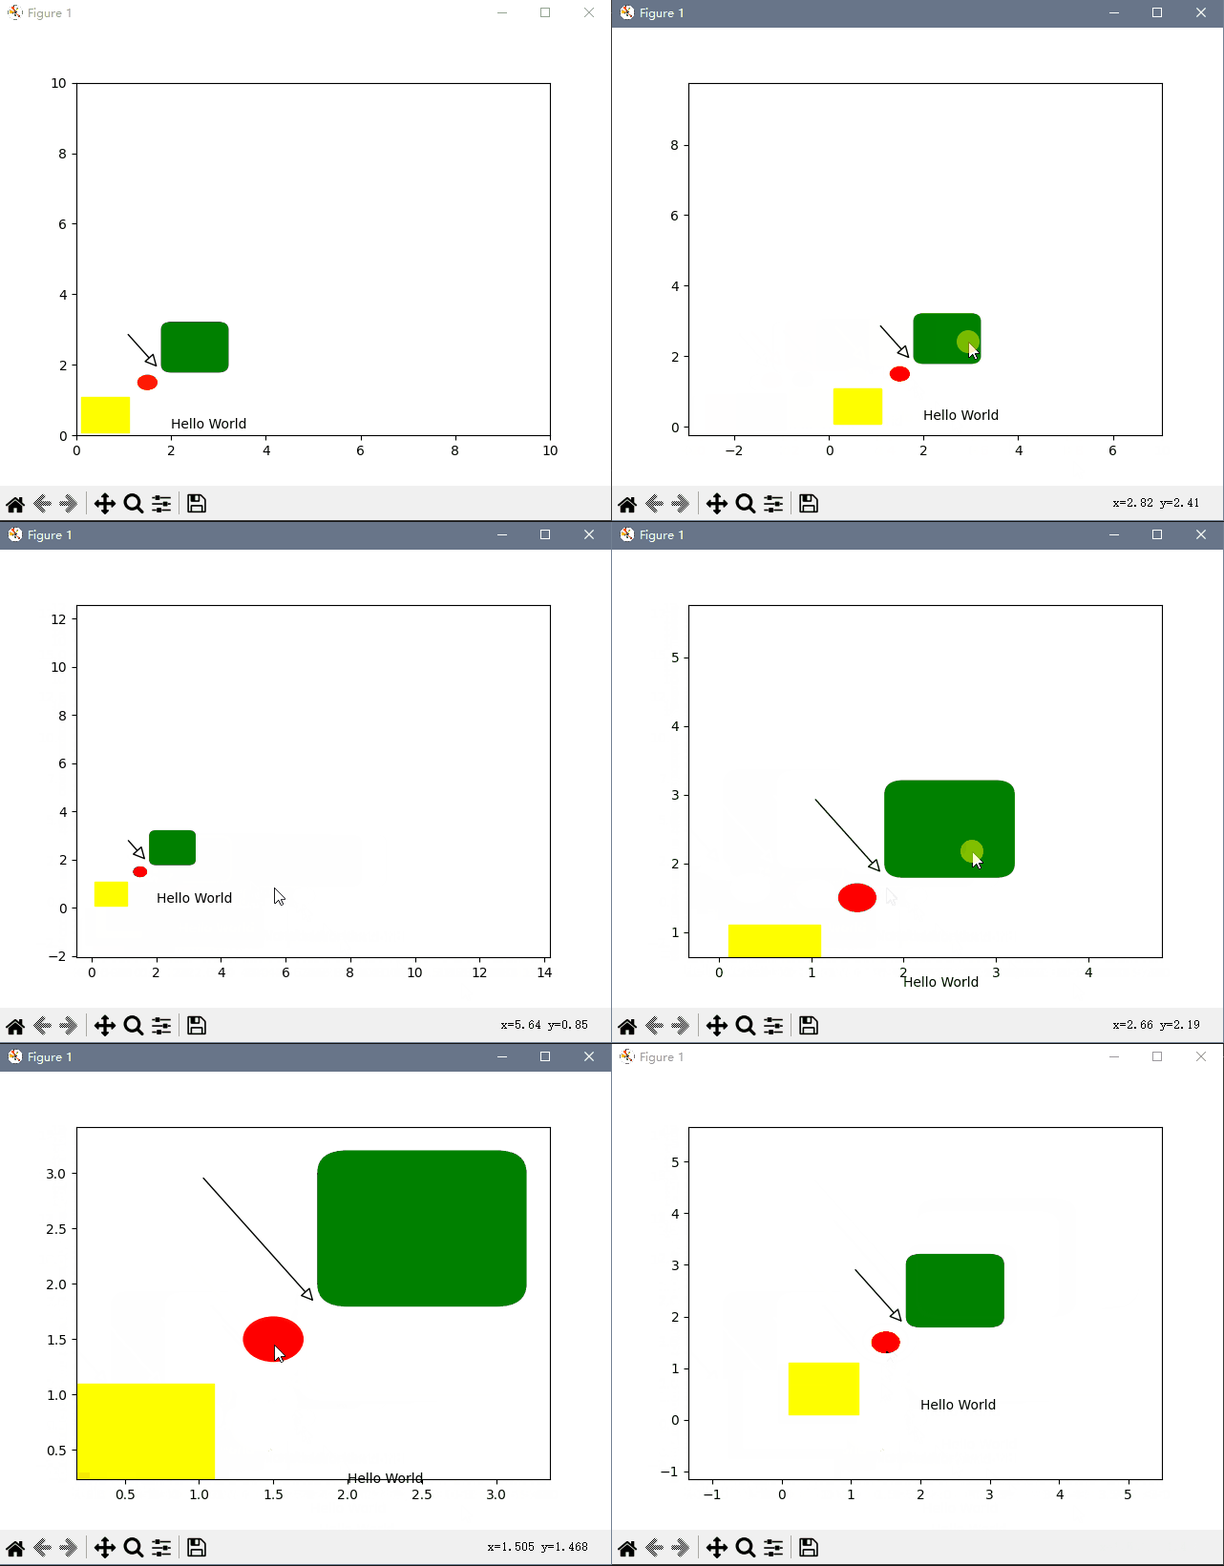
单独鼠标缩放拖动动态改变坐标轴范围-效果

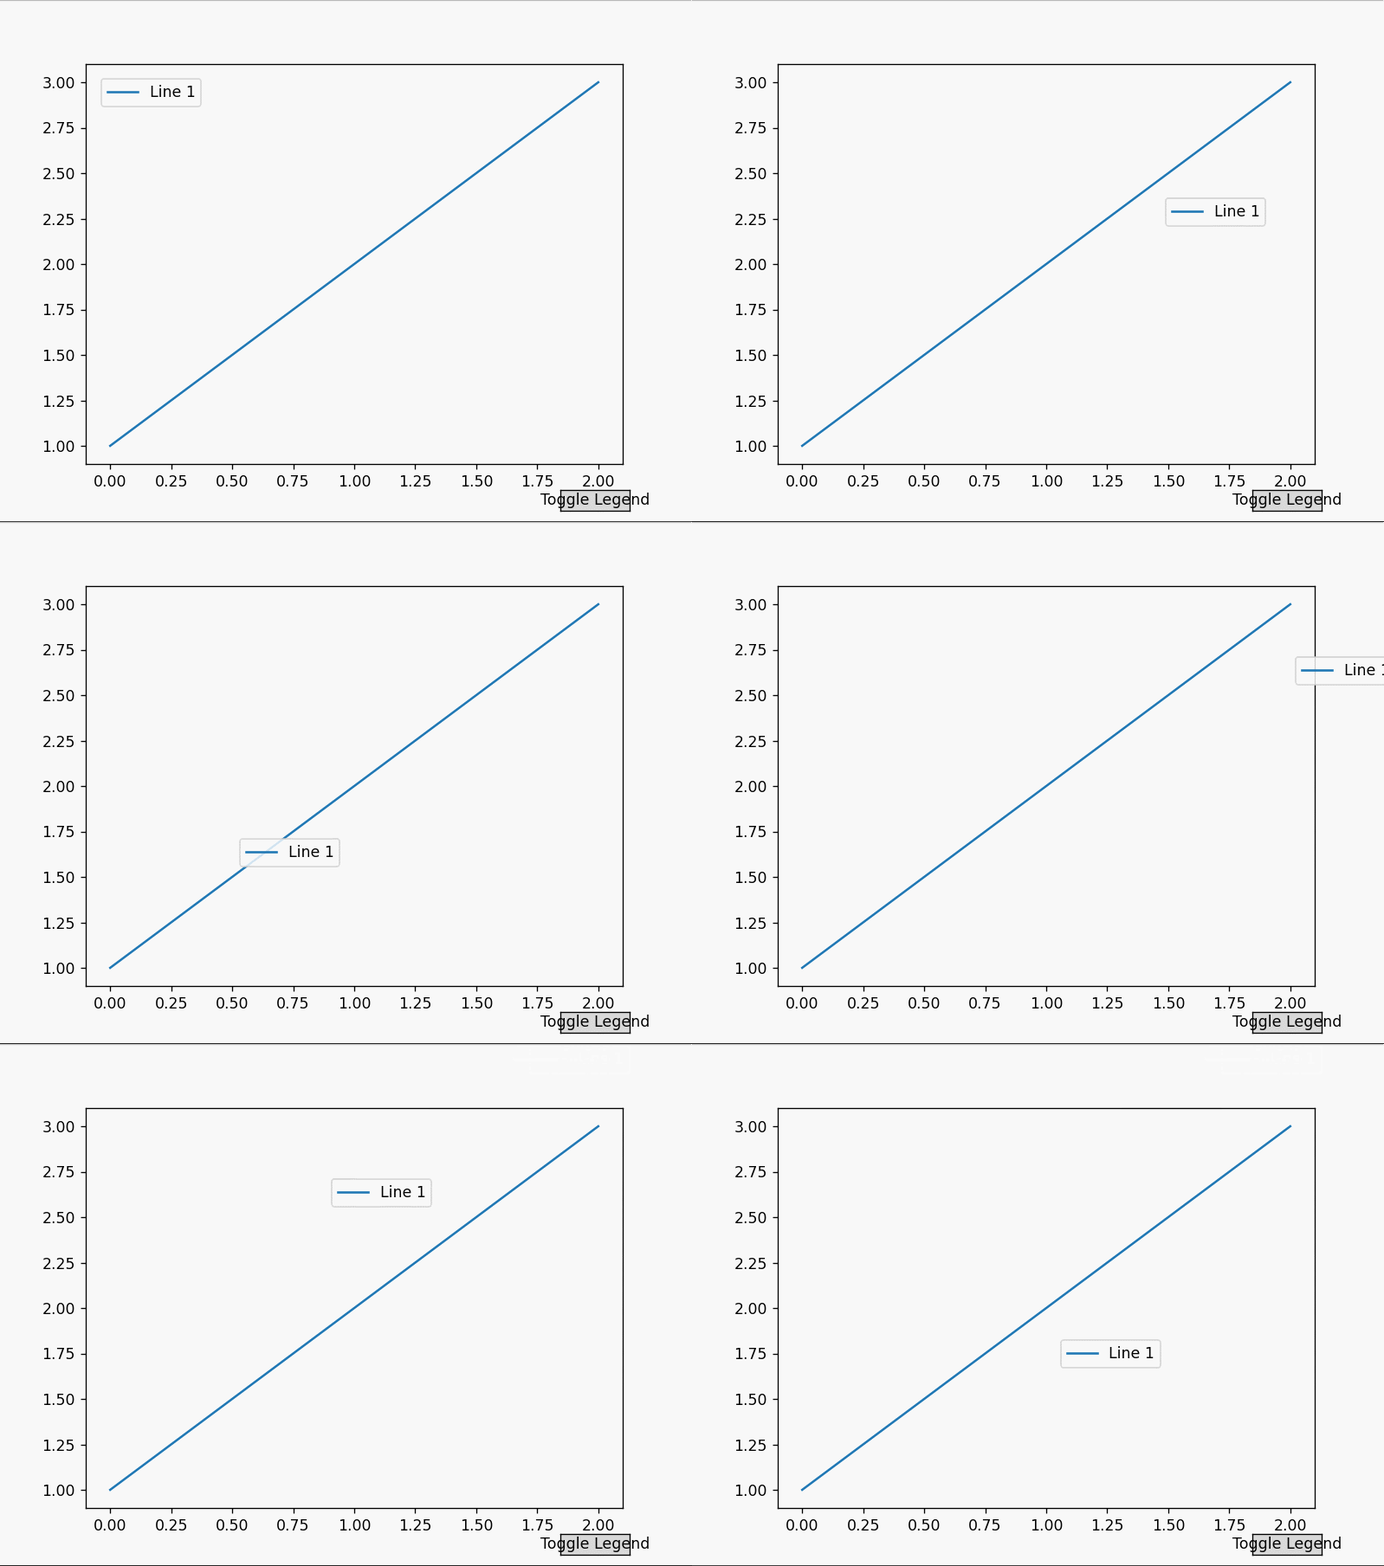
单独拖动图例效果

直接把二者结合起来,会因为Axis占用鼠标事件,而导致拖动图例失效,
进行一些坐标判断,判断鼠标的单击坐标是否在图例所在的区域内,然后进行区分即可完美实现。
if axtemp.get_legend():
	legend_bbox = axtemp.get_legend().get_window_extent()
	left_bottom = legend_bbox.get_points()[0]
	right_top = legend_bbox.get_points()[1]
	if left_bottom[0] <= mouse_x <= right_top[0] and left_bottom[1] <= mouse_y <= right_top[1]:
		# print("在图例上按下鼠标")
		# 在图例上按下鼠标
		mPress = False
直接上代码:
import matplotlib.pyplot as plt
from matplotlib.ticker import AutoLocator, MultipleLocator, MaxNLocator

plt.rcParams["font.family"] = "Microsoft YaHei"

# 创建一个示例图形
fig, ax = plt.subplots()
ax.plot([1, 2, 3, ], [2, 4, 6, ], label=f'位移', ls='-')

# 使用AutoLocator自动选择刻度位置
# ax.xaxis.set_major_locator(AutoLocator())
ax.yaxis.set_major_locator(AutoLocator())
# 使用MultipleLocator设置x轴刻度间隔为100
# ax.xaxis.set_major_locator(MultipleLocator(200))
# ax.yaxis.set_major_locator(MultipleLocator(100))
# 使用MaxNLocator设置x轴刻度最多显示5个
ax.xaxis.set_major_locator(MaxNLocator(10))

ax.set_xlabel('时间(s)', color='black')
ax.set_ylabel('位移(m)', color='black')

ax.legend(loc='lower right',    #  设置图例位置
          labelspacing=0,   #   设置图例间距
          handlelength=2,   #    设置图例中线的长度
          ncol=4,   #    设置图例的列数
          fontsize=8,   #     设置图例字体大小
          shadow=True,  #     设置图例阴影
          draggable=True    #  设置图例可拖动
          )


startx = 0
starty = 0
mPress = False

# 鼠标拖动 处理事件
def call_move(event):
    # print(event.name)
    global mPress
    global startx
    global starty
    mouse_x = event.x
    mouse_y = event.y
    axtemp = event.inaxes
    if event.name == 'button_press_event':
        if axtemp and event.button == 1:
            if axtemp.get_legend():
                legend_bbox = axtemp.get_legend().get_window_extent()
                left_bottom = legend_bbox.get_points()[0]
                right_top = legend_bbox.get_points()[1]

                if left_bottom[0] <= mouse_x <= right_top[0] and left_bottom[1] <= mouse_y <= right_top[1]:
                    # print("在图例上按下鼠标")
                    # 在图例上按下鼠标
                    mPress = False
                    return
            # 没有图例的情况
            # print("在 Axes 上按下鼠标")
            # 在 Axes 上按下鼠标
            mPress = True
            startx = event.xdata
            starty = event.ydata
            return
    elif event.name == 'button_release_event':
        if axtemp and event.button == 1:
            mPress = False
    elif event.name == 'motion_notify_event':
        if axtemp and event.button == 1 and mPress:
            if axtemp.get_legend():
                legend_bbox = axtemp.get_legend().get_window_extent()
                left_bottom = legend_bbox.get_points()[0]
                right_top = legend_bbox.get_points()[1]

                if left_bottom[0] <= mouse_x <= right_top[0] and left_bottom[1] <= mouse_y <= right_top[1]:
                    print("在图例上移动鼠标")
                    # 在图例上按下鼠标
                    mPress = False
                    return

            # 没有图例的情况
            # print("在Axes上移动鼠标")
            x_min, x_max = axtemp.get_xlim()
            y_min, y_max = axtemp.get_ylim()
            w = x_max - x_min
            h = y_max - y_min
            # print(event)
            # 移动
            mx = event.xdata - startx
            my = event.ydata - starty
            # 注意这里, -mx,  因为下一次 motion事件的坐标,已经是在本次做了移动之后的坐标系了,所以要体现出来
            # startx=event.xdata-mx  startx=event.xdata-(event.xdata-startx)=startx, 没必要再赋值了
            # starty=event.ydata-my
            # print(mx,my,x_min,y_min,w,h)
            axtemp.set(xlim=(x_min - mx, x_min - mx + w))
            axtemp.set(ylim=(y_min - my, y_min - my + h))
            fig.canvas.draw_idle()  # 绘图动作实时反映在图像上

    return

# 滚轮滚动 处理事件
def call_scroll(event):
    # print(event.name)
    axtemp = event.inaxes
    # print('event:', event)
    # print(event.xdata, event.ydata)
    # 计算放大缩小后, xlim 和ylim
    if axtemp:
        x_min, x_max = axtemp.get_xlim()
        y_min, y_max = axtemp.get_ylim()
        w = x_max - x_min
        h = y_max - y_min
        curx = event.xdata
        cury = event.ydata
        curXposition = (curx - x_min) / w
        curYposition = (cury - y_min) / h
        if event.button == 'down':
            # print('befor:', w, h)
            w = w * 1.1
            h = h * 1.1
            # print('down', w, h)
        elif event.button == 'up':
            # print('befor:', w, h)
            w = w / 1.1
            h = h / 1.1
            # print('up', w, h)
        # print(curXposition, curYposition)
        newx = curx - w * curXposition
        newy = cury - h * curYposition
        axtemp.set(xlim=(newx, newx + w))
        axtemp.set(ylim=(newy, newy + h))
        fig.canvas.draw_idle()  # 绘图动作实时反映在图像上


fig.canvas.mpl_connect('scroll_event', call_scroll)
fig.canvas.mpl_connect('button_press_event', call_move)
fig.canvas.mpl_connect('button_release_event', call_move)
# fig.canvas.mpl_connect('draw_event', call_move)
fig.canvas.mpl_connect('motion_notify_event', call_move)


plt.show()
文章来源:https://blog.csdn.net/qq_43324506/article/details/135017384
本文来自互联网用户投稿,该文观点仅代表作者本人,不代表本站立场。本站仅提供信息存储空间服务,不拥有所有权,不承担相关法律责任。 如若内容造成侵权/违法违规/事实不符,请联系我的编程经验分享网邮箱:chenni525@qq.com进行投诉反馈,一经查实,立即删除!
本文来自互联网用户投稿,该文观点仅代表作者本人,不代表本站立场。本站仅提供信息存储空间服务,不拥有所有权,不承担相关法律责任。 如若内容造成侵权/违法违规/事实不符,请联系我的编程经验分享网邮箱:chenni525@qq.com进行投诉反馈,一经查实,立即删除!
最新文章
- Python教程
- 深入理解 MySQL 中的 HAVING 关键字和聚合函数
- Qt之QChar编码(1)
- MyBatis入门基础篇
- 用Python脚本实现FFmpeg批量转换
- 开源网安年终总结 | 逐梦不止步,蓄势攀高峰
- 智谱AI官网再升级,GLM-4,智能体,AI作图长文档全部搞定
- 推挽输出、开漏输出、上拉输入、下拉输入、浮空输入。
- 2024年MIA最新生成综述:基于深度学习的MRI/CT/PET合成【文献阅读】
- dell服务器 R740xd安装windows server 2019过程记录
- ROS2——发布和订阅
- 基于SpringBoot的靓车汽车销售网站
- 渲染农场支持的最大尺寸是多少?
- k8s之pod的基础(下)
- 一开始我还不信!高德导航红绿灯竟然能读秒?