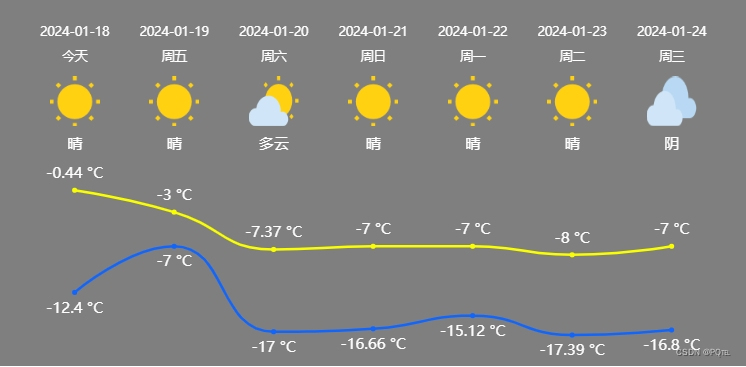
Echart 制作未来7天天气预报图
发布时间:2024年01月18日
效果

前置说明
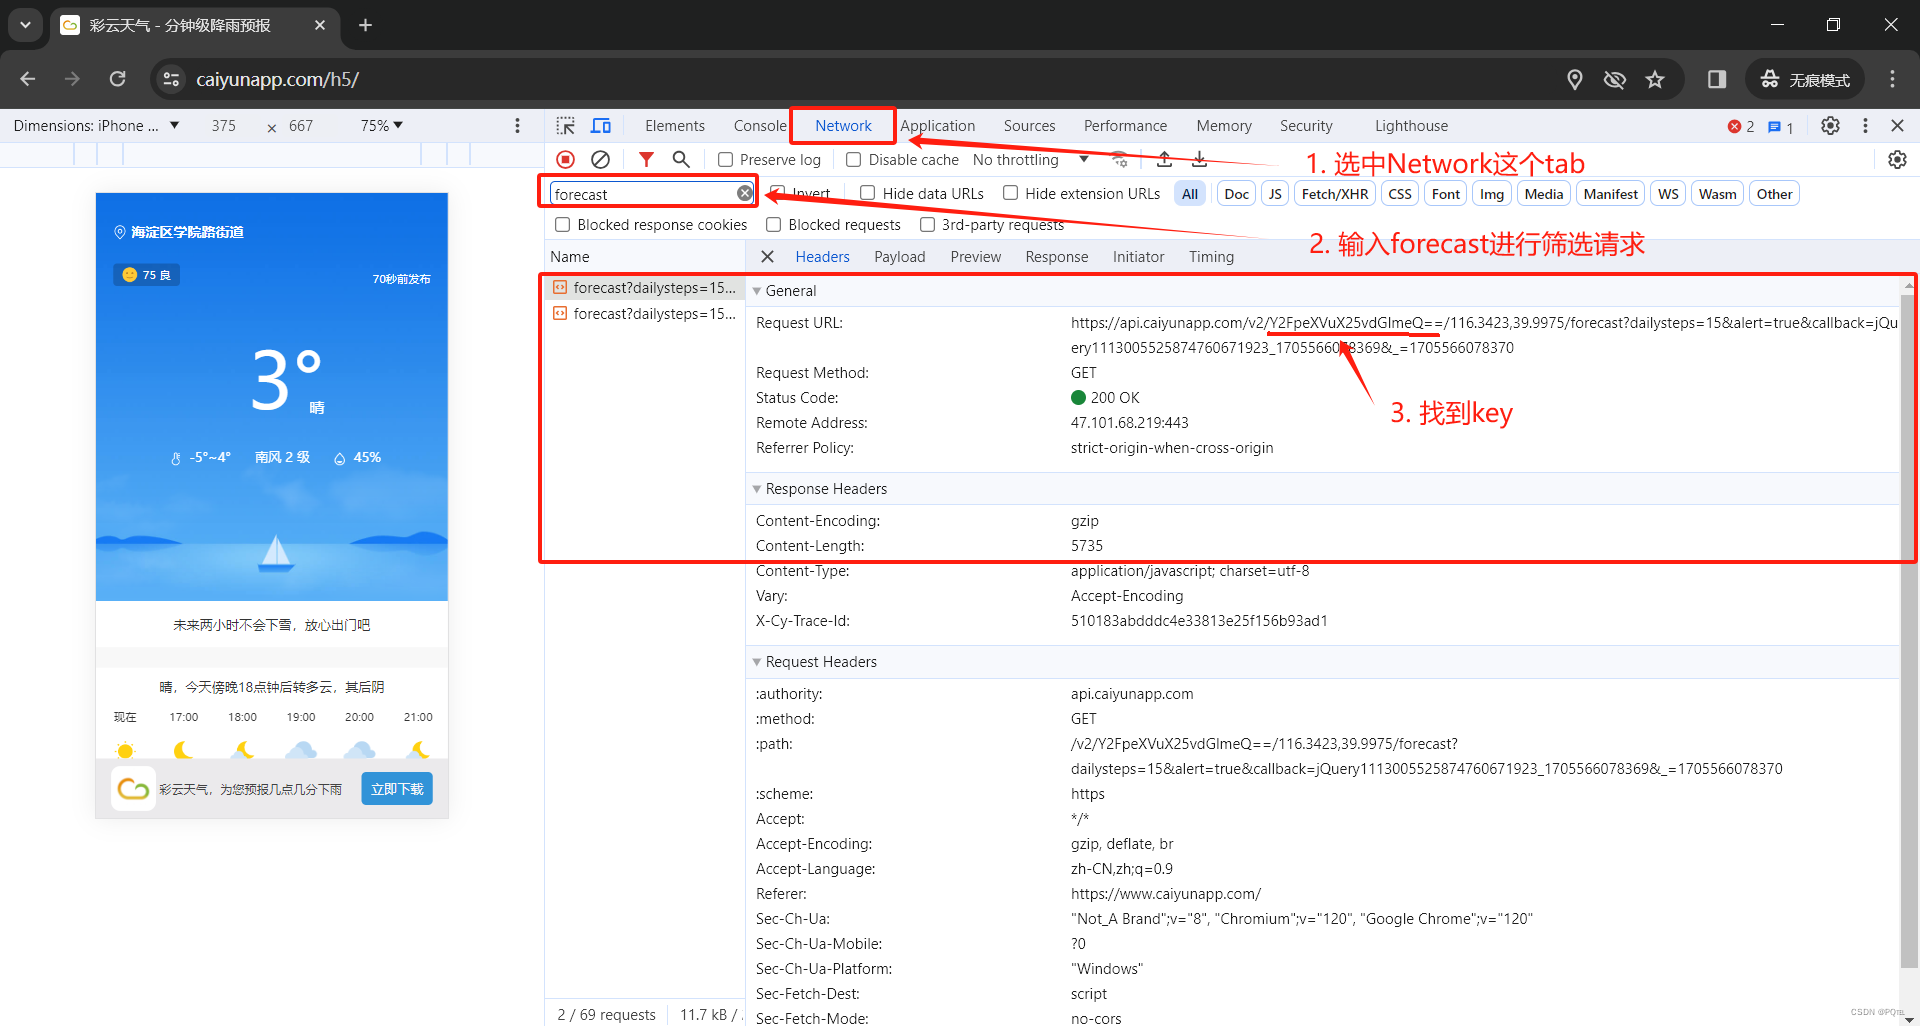
天气数据是从彩云天气获取的。详细参数含义请查看文档。关于请求API用到的key,大家可以在彩云官网进行申请试用。当然大家本着体验学习不想申请试用的话,看这里学着分析提取key。
代码
通过代理的方式解决前端本地开发请求彩云天气接口的跨域问题
vite.config.ts
import { defineConfig } from 'vite'
import vue from '@vitejs/plugin-vue'
export default defineConfig({
  server: {
    proxy: {
      '/caiyun-weather': {
        target: 'https://api.caiyunapp.com',
        changeOrigin: true,
        ws: true,
        rewrite: (path) => path.replace(/^\/caiyun-weather/, ''),
      },
    },
  },
  plugins: [vue()],
})
index.vue
html
<template>
  <div class="weather-content" ref="echartRef"></div>
</template>
ts
<script lang="ts" setup>
import { ref, onMounted } from 'vue'
import axios from 'axios'
import * as echarts from 'echarts'

const echartRef = ref()

const tem1 = ref<number[]>([]) //最高温度
const tem2 = ref<number[]>([]) //最低温度
const weatherDate = ref<string[]>([]) // 日期
const weatherDay = ref<string[]>([])
const weaterImg = ref<string[]>([])
const weaterDesc = ref<string[]>([])
const WEEKDAY = ['周日', '周一', '周二', '周三', '周四', '周五', '周六']

async function getWeather() {
  // v2.6 是api版本号
  // Y2FpeXVuX25vdGlmeQ== 是调用api需要用到的key
  // 101.6656,39.2072 是要查询位置的经纬度
  const { data } = await axios({
    url: '/caiyun-weather/v2.6/Y2FpeXVuX25vdGlmeQ==/101.6656,39.2072/daily',
    method: 'get',
    params: {
      dailysteps: 7,
    },
  })
  let { status, result, error } = data
  if (status != 'ok') {
    alert(error)
    return
  }
  let { temperature_08h_20h, temperature_20h_32h, skycon, precipitation } = result.daily
  const Today = new Date().getDay()
  for (let i = 0; i < temperature_08h_20h.length; i++) {
    tem1.value.push(temperature_08h_20h[i].max)
    tem2.value.push(temperature_20h_32h[i].min)
    weatherDate.value.push(temperature_08h_20h[i].date.substr(0, 10))
    weatherDay.value.push(i == 0 ? '今天' : WEEKDAY[(Today + i) % 7])
    weaterImg.value.push(getSkyIconPicName(skycon[i].value, precipitation[i].avg))
    weaterDesc.value.push(parseSkycon(skycon[i].value))
  }
}

function initEchart() {
  const Color = ['#FAFF00', '#1165FF']

  let options = {
    grid: {
      show: true,
      backgroundColor: 'transparent',
      opacity: 0.3,
      borderWidth: '0',
      top: '150',
      bottom: '20',
    },
    tooltip: { trigger: 'axis' },
    legend: { show: false },
    xAxis: [
      {
        type: 'category',
        boundaryGap: false,
        position: 'top',
        offset: 110,
        zlevel: 100,
        axisLine: {
          show: false,
        },
        axisTick: {
          show: false,
        },
        axisLabel: {
          interval: 0,
          formatter: ['{a|{value}}'].join('\n'),
          rich: {
            a: {
              color: 'white',
              fontSize: 14,
              fontFamily: 'Alibaba PuHuiTi 2-75 SemiBold',
            },
          },
        },
        nameTextStyle: {},
        data: weatherDate.value,
      },
      {
        type: 'category',
        boundaryGap: false,
        position: 'top',
        offset: 90,
        zlevel: 100,
        axisLine: {
          show: false,
        },
        axisTick: {
          show: false,
        },
        axisLabel: {
          interval: 0,
          formatter: ['{a|{value}}'].join('\n'),
          rich: {
            a: {
              color: 'white',
              fontSize: 12,
              fontFamily: 'Alibaba PuHuiTi 2-75 SemiBold',
            },
          },
        },
        nameTextStyle: {
          fontWeight: 'bold',
          fontSize: 19,
        },
        data: weatherDay.value,
      },
      {
        type: 'category',
        boundaryGap: false,
        position: 'top',
        offset: 10,
        zlevel: 100,
        axisLine: {
          show: false,
        },
        axisTick: {
          show: false,
        },
        axisLabel: {
          interval: 0,
          formatter: function (value: any, index: any) {
            return '{' + index + '| }\n{b|' + value + '}'
          },
          rich: {
            ...weaterImg.value.reduce((obj: any, image: string, index: number) => {
              obj[index] = {
                backgroundColor: { image },
                height: 40,
                width: 40,
              }
              return obj
            }, {}),
            b: {
              color: 'white',
              fontSize: 12,
              lineHeight: 30,
              height: 20,
            },
          },
        },
        data: weaterDesc.value,
      },
    ],
    yAxis: {
      type: 'value',
      show: false,
      axisLabel: {
        formatter: '{value} °C',
        color: 'white',
      },
    },
    series: [
      {
        name: '最高气温',
        type: 'line',
        data: tem1.value,
        symbol: 'circle',
        smooth: true,
        itemStyle: { color: Color[0] },
        label: {
          show: true,
          position: 'top',
          color: 'white',
          formatter: '{c} °C',
        },
        lineStyle: { color: Color[0] },
      },
      {
        name: '最低气温',
        type: 'line',
        data: tem2.value,
        symbol: 'circle',
        smooth: true,
        itemStyle: { color: Color[1] },
        label: {
          show: true,
          position: 'bottom',
          color: 'white',
          formatter: '{c} °C',
        },
        lineStyle: { color: Color[1] },
      },
    ],
  }

  let instance = echarts.getInstanceByDom(echartRef.value)
  if (instance) {
    instance.setOption(options)
  } else {
    echarts.init(echartRef.value).setOption(options)
  }
}

onMounted(async () => {
  await getWeather()
  initEchart()
})

/**
 * 获取天气图标名称
 * https://www.caiyunapp.com/h5/js/process-data.js
 * @param skycon
 * @param prec
 */
function getSkyIconPicName(skycon: string, prec: number) {
  var allPicName = {
    CLEAR: 'clear.png',
    CLEAR_NIGHT: 'clear_night.png',
    PARTLY_CLOUDY: 'partly_cloudy.png',
    PARTLY_CLOUDY_NIGHT: 'partly_cloudy_night.png',
    CLOUDY: 'cloudy.png',
    SNOW: 'snow.png',
    RAIN: 'rain.png',
    FOG: 'fog.png',
    HAZE: 'haze.png',
    WIND: 'wind.png',
  }
  // @ts-ignore
  var name = allPicName[skycon.match(/CLEAR_NIGHT|CLEAR|PARTLY_CLOUDY_NIGHT|PARTLY_CLOUDY|CLOUDY|SNOW|RAIN|FOG|HAZE|WIND|/)[0]] || 'partly_cloudy.png'
  if (prec && prec > 1) {
    if (prec < 10) {
      name = 'rain_low.png'
    } else if (prec < 25) {
      name = 'rain_middle.png'
    } else if (prec < 50) {
      name = 'rain_high.png'
    } else {
      name = 'rain_large.png'
    }
  }

  return 'https://caiyunapp.com/images/skyicon/' + name
}

/**
 * 将天气现象转成中文
 * https://www.caiyunapp.com/h5/js/process-data.js
 * @param skycon
 */
function parseSkycon(skycon: string) {
  const allDesc: any = {
    CLEAR_DAY: '晴',
    CLEAR_NIGHT: '晴',
    PARTLY_CLOUDY_DAY: '多云',
    PARTLY_CLOUDY_NIGHT: '多云',
    CLOUDY: '阴',
    CLOUDY_NIGHT: '阴',
    RAIN: '雨',
    SNOW: '雪',
    SNOW_NIGHT: '雪',
    WIND: '大风',
    FOG: '雾',
    HAZE: '雾霾',
  }
  return allDesc[skycon] || allDesc['CLEAR_DAY']
}
</script>
style
<style scoped>
.weather-content {
  width: 590px;
  height: 290px;
  background: rgba(0, 0, 0, 0.5);
}
</style>
完事。
分析官网提取key
浏览器打开彩云天气官网天气预报页面:https://www.caiyunapp.com/h5/
- 在浏览器打开上述链接, 按
F12打开控制台, 再次刷新页面 - 选中
Network这个tab - 输入
forecast过滤请求 - 根据彩云天气API规则可知
v2这个版本号后面跟着的字符串就是key

文章来源:https://blog.csdn.net/weixin_42353499/article/details/135676247
本文来自互联网用户投稿,该文观点仅代表作者本人,不代表本站立场。本站仅提供信息存储空间服务,不拥有所有权,不承担相关法律责任。 如若内容造成侵权/违法违规/事实不符,请联系我的编程经验分享网邮箱:chenni525@qq.com进行投诉反馈,一经查实,立即删除!
本文来自互联网用户投稿,该文观点仅代表作者本人,不代表本站立场。本站仅提供信息存储空间服务,不拥有所有权,不承担相关法律责任。 如若内容造成侵权/违法违规/事实不符,请联系我的编程经验分享网邮箱:chenni525@qq.com进行投诉反馈,一经查实,立即删除!
最新文章
- Python教程
- 深入理解 MySQL 中的 HAVING 关键字和聚合函数
- Qt之QChar编码(1)
- MyBatis入门基础篇
- 用Python脚本实现FFmpeg批量转换
- Servlet-体系结构
- helpdesk与Local IT有什么区别?
- 免费的XShell替代品,又一国产良心工具
- 【漏洞复现】某检测系统(admintool)接口任意文件上传漏洞
- [精品毕设]基于Uniapp+springboot校园学校趣事管理系统app
- 揭秘阿里自研搜索引擎 Havenask 在线检索服务
- 翻页的电子画册如何制作
- R语言【taxa】——从taxa 定义的类中获取组分信息
- LVS+Keepalived集群
- (附源码)SSM银行账目管理平台 计算机毕设43684