R语言【paleobioDB】——pbdb_temporal_resolution():展示化石数据的时空分辨率
发布时间:2024年01月18日
Package?paleobioDB?version 0.7.0
paleobioDB 包在2020年已经停止更新,该包依赖PBDB v1 API。
可以选择在Index of /src/contrib/Archive/paleobioDB (r-project.org)下载安装包后,执行本地安装。
Usage
pbdb_temporal_resolution (data, do.plot=TRUE)Arguments
参数【data】:输入的数据,数据帧格式。可以通过 pbdb_occurrences() 函数获得数据。
参数【do.plot】:TRUE/FALSE。默认为 TRUE。
Value
一个图和一个列表,其中包含数据的时间分辨率(最小值、最大值、第 1 和第 3 个四分位数、中位数和平均值)以及每个化石记录的时间分辨率 (马) 的摘要。
Example
library(paleobioDB)
library(RCurl)

options(RCurlOptions = list(cainfo = system.file("CurlSSL", "cacert.pem", package = "RCurl")))


data<- pbdb_occurrences (taxon_name= "Canidae", interval= "Quaternary")

pbdb_temporal_resolution (data)


$summary
   Min. 1st Qu.  Median    Mean 3rd Qu.    Max.
 0.0117  0.3846  1.5000  2.2046  2.8440 23.0183

$temporal_resolution
 [1]  3.1000  4.6000  3.1000  3.1000  3.1000  3.1000  3.1000  3.1000
 [9]  4.6000  3.1000  1.5000  1.5000  1.5000  1.5000  1.5000  1.5000
[17]  1.5000  1.0250  0.7693  1.8070  2.5763  2.5763  2.5763  2.5763
[25]  2.5763  5.3213  2.5763  0.7693 23.0183  0.6550  2.5763  0.6550
[33]  0.6550  8.5000  0.6550  3.1000  0.1143  0.1143  2.5880  0.1143
[41]  0.1143  1.8070  0.1143  0.1143  0.1143  2.5880  0.1143  2.5763
[49]  0.1143  1.8070  0.0117  0.6550  0.1143  4.6000  0.0117  0.0117
[57]  0.1143  2.5763  0.1143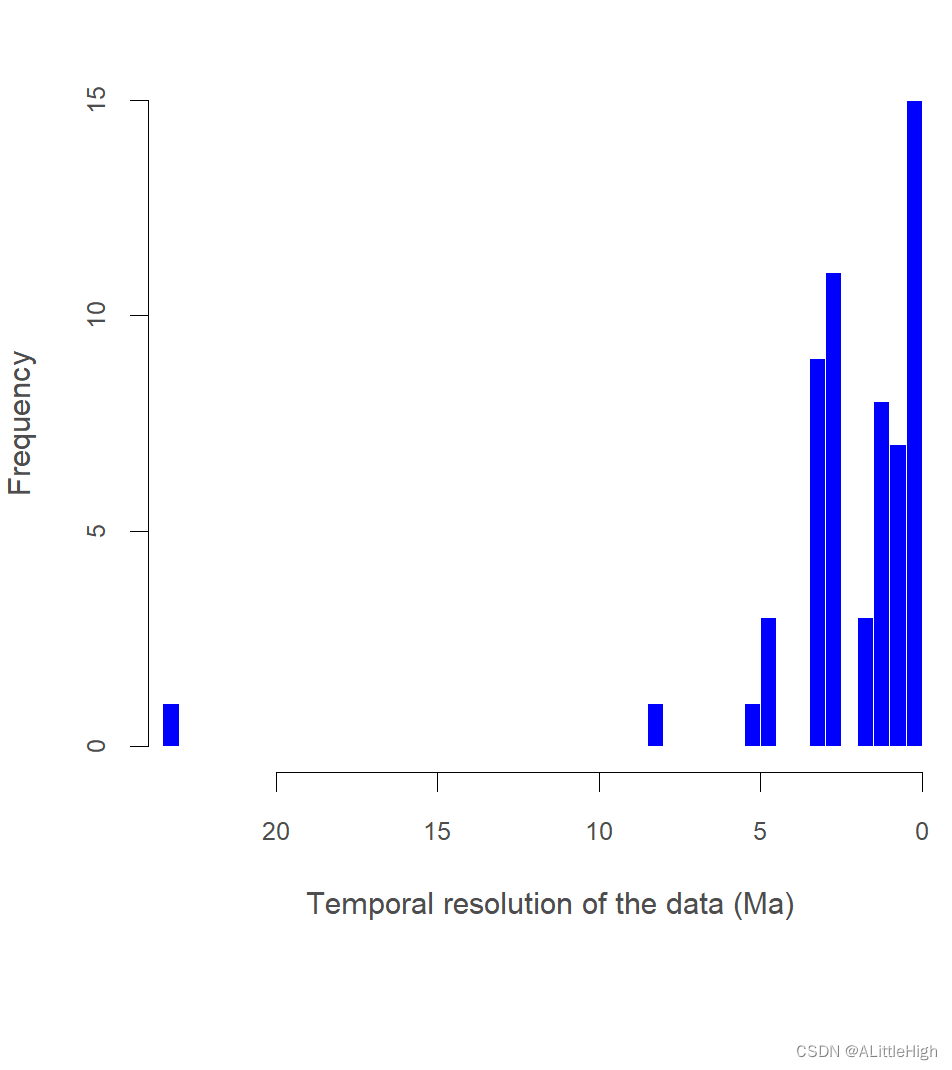
Page
function (data, do.plot = TRUE)
{
    if ("eag" %in% colnames(data)) {
        diff <- .numeric_age(data$eag) - .numeric_age(data$lag)
        tr <- list(summary = summary(diff), temporal_resolution = diff)
    }
    if ("early_age" %in% colnames(data)) {
        diff <- .numeric_age(data$early_age) - .numeric_age(data$late_age)
        tr <- list(summary = summary(diff), temporal_resolution = diff)
    }
    if (do.plot == TRUE) {
        hist(unlist(tr[[2]]), freq = T, col = "#0000FF", border = F,
            xlim = c(max(unlist(tr[[2]]), na.rm = TRUE), 0),
            breaks = 50, xlab = "Temporal resolution of the data (Ma)",
            main = "", col.lab = "grey30", col.axis = "grey30",
            cex.axis = 0.8)
    }
    return(tr)
}
文章来源:https://blog.csdn.net/whitedrogen/article/details/135602159
本文来自互联网用户投稿,该文观点仅代表作者本人,不代表本站立场。本站仅提供信息存储空间服务,不拥有所有权,不承担相关法律责任。 如若内容造成侵权/违法违规/事实不符,请联系我的编程经验分享网邮箱:chenni525@qq.com进行投诉反馈,一经查实,立即删除!
本文来自互联网用户投稿,该文观点仅代表作者本人,不代表本站立场。本站仅提供信息存储空间服务,不拥有所有权,不承担相关法律责任。 如若内容造成侵权/违法违规/事实不符,请联系我的编程经验分享网邮箱:chenni525@qq.com进行投诉反馈,一经查实,立即删除!
最新文章
- Python教程
- 深入理解 MySQL 中的 HAVING 关键字和聚合函数
- Qt之QChar编码(1)
- MyBatis入门基础篇
- 用Python脚本实现FFmpeg批量转换
- quartz在创建定时任务时,首次执行定时任务时出现多次重复执行的问题
- 如何让亚马逊,速卖通,美客多店铺排名和流量稳定爬升
- 目标检测YOLO实战应用案例100讲-基于视觉的道路交通环境感知
- EDM打开率突然下降的原因:深入分析并采取应对措施
- 销售团队如何实现业绩增长?CRM系统的线索管理功能有什么用?
- Kibana:使用反向地理编码绘制自定义区域地图
- 四川古力未来科技公司抖音小店:探索新商业机会的理想选择!
- 帮你找到99%的电子书,这46个免费电子书网站,你还不知道吗?
- Mybatis之逆向工程
- transbigdata笔记:栅格参数优化