HighTec自带UDE使用(四)
发布时间:2024年01月09日
之前一直以为UDE里不能用图像来看数据变化,只能用变量看,最近发现它也是可以调出图像来的,在这里记录一下。
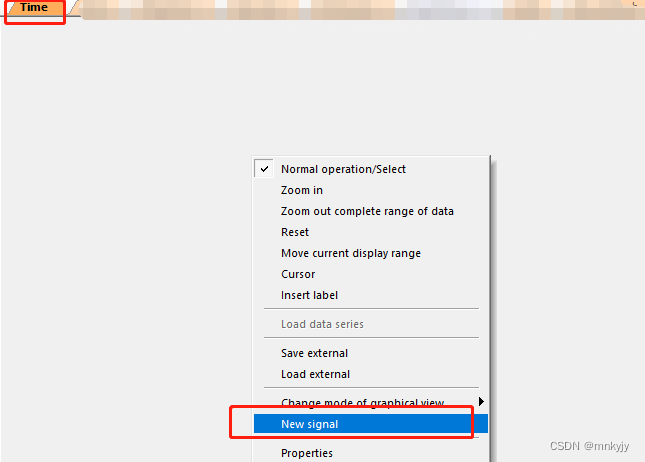
1、打开Time/Value Chart

2、在打开的页面中选择New Signal
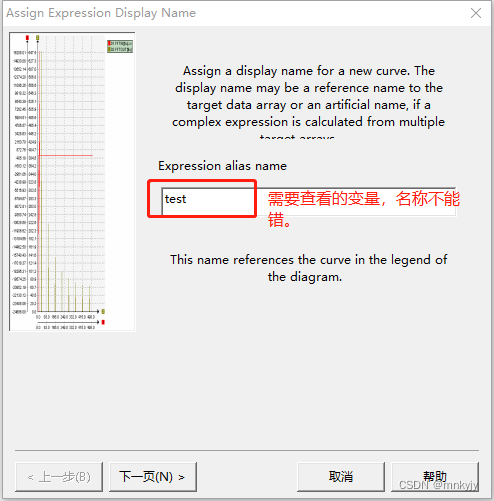
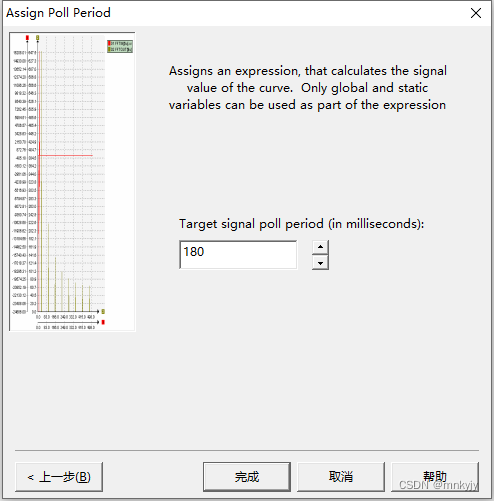
3、根据指示填写需要观测的变量。
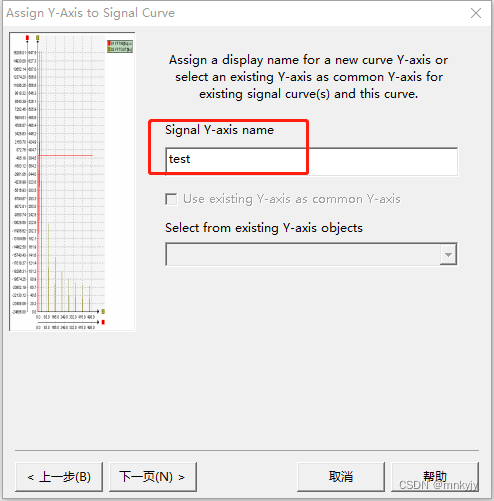
4、同上
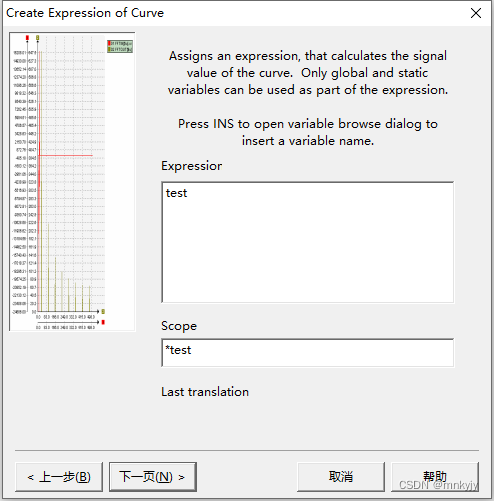
5、同上
6、这里不是最终的设置
7、这个选项可以设置坐标的各种值

8、设置
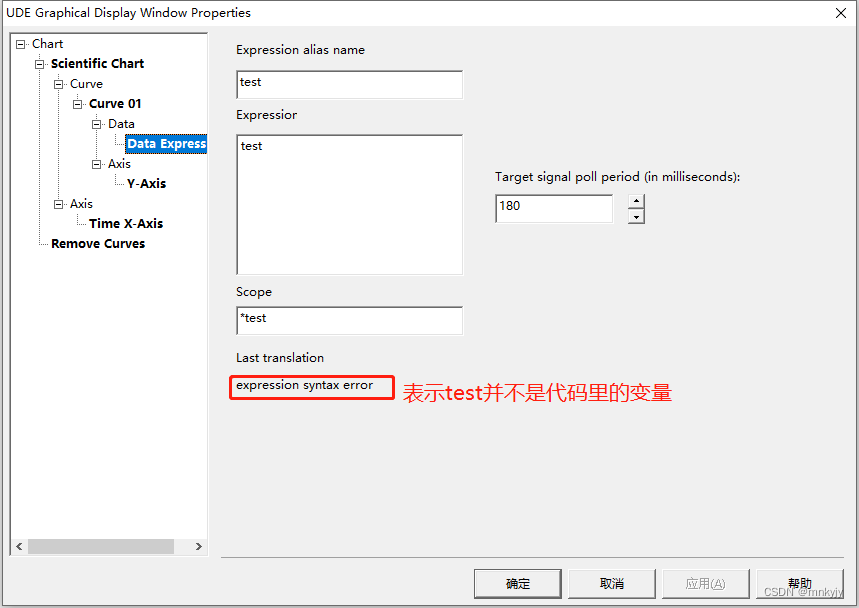
9、Y轴

10、X轴

文章来源:https://blog.csdn.net/mnkyjy/article/details/135483684
本文来自互联网用户投稿,该文观点仅代表作者本人,不代表本站立场。本站仅提供信息存储空间服务,不拥有所有权,不承担相关法律责任。 如若内容造成侵权/违法违规/事实不符,请联系我的编程经验分享网邮箱:chenni525@qq.com进行投诉反馈,一经查实,立即删除!
本文来自互联网用户投稿,该文观点仅代表作者本人,不代表本站立场。本站仅提供信息存储空间服务,不拥有所有权,不承担相关法律责任。 如若内容造成侵权/违法违规/事实不符,请联系我的编程经验分享网邮箱:chenni525@qq.com进行投诉反馈,一经查实,立即删除!
最新文章