比较两个信号的频率成分
发布时间:2024年01月04日
频谱相干性有助于识别频域中信号之间的相似性。大数值表示信号共有的频率分量。
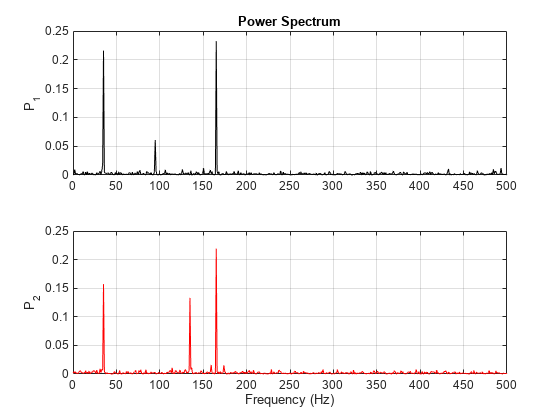
????????将两个声音信号加载到工作区中。以 1 kHz 的频率对其进行采样。使用 periodogram 计算其功率频谱,并以彼此相邻的方式对其绘图。
load relatedsig

Fs = FsSig;

[P1,f1] = periodogram(sig1,[],[],Fs,'power');
[P2,f2] = periodogram(sig2,[],[],Fs,'power');

subplot(2,1,1)
plot(f1,P1,'k')
grid
ylabel('P_1')
title('Power Spectrum')

subplot(2,1,2)
plot(f2,P2,'r')
grid
ylabel('P_2')
xlabel('Frequency (Hz)')
如图所示:

????????每个信号有三个具有显著能量的频率分量。其中有两个分量似乎是共享分量。使用 findpeaks 求出对应的频率。
[pk1,lc1] = findpeaks(P1,'SortStr','descend','NPeaks',3);
P1peakFreqs = f1(lc1)
P1peakFreqs = 3×1

  165.0391
   35.1562
   94.7266


[pk2,lc2] = findpeaks(P2,'SortStr','descend','NPeaks',3);
P2peakFreqs = f2(lc2)
P2peakFreqs = 3×1

  165.0391
   35.1562
  134.7656
????????公共分量位于大约 165 和 35 Hz 处。可以使用 mscohere 直接求出匹配的频率。对相干性估计绘图。找到阈值 0.75 以上的波峰。
[Cxy,f] = mscohere(sig1,sig2,[],[],[],Fs);

thresh = 0.75;
[pks,locs] = findpeaks(Cxy,'MinPeakHeight',thresh);
MatchingFreqs = f(locs)
MatchingFreqs = 2×1

   35.1562
  164.0625


figure
plot(f,Cxy)
ax = gca;
grid
xlabel('Frequency (Hz)')
title('Coherence Estimate')
ax.XTick = MatchingFreqs;
ax.YTick = thresh;
axis([0 200 0 1])
如图所示:

????????得到的值和以前一样。可以找到两个信号共有的频率成分,而无需分别研究这两个信号。
文章来源:https://blog.csdn.net/jk_101/article/details/134420692
本文来自互联网用户投稿,该文观点仅代表作者本人,不代表本站立场。本站仅提供信息存储空间服务,不拥有所有权,不承担相关法律责任。 如若内容造成侵权/违法违规/事实不符,请联系我的编程经验分享网邮箱:chenni525@qq.com进行投诉反馈,一经查实,立即删除!
本文来自互联网用户投稿,该文观点仅代表作者本人,不代表本站立场。本站仅提供信息存储空间服务,不拥有所有权,不承担相关法律责任。 如若内容造成侵权/违法违规/事实不符,请联系我的编程经验分享网邮箱:chenni525@qq.com进行投诉反馈,一经查实,立即删除!
最新文章
- Python教程
- 深入理解 MySQL 中的 HAVING 关键字和聚合函数
- Qt之QChar编码(1)
- MyBatis入门基础篇
- 用Python脚本实现FFmpeg批量转换
- 天猫企业店铺商家电话采集软件使用教程
- SASS简介及使用方法
- 智慧医疗平台开发:在线问诊系统源码搭建详解
- 为何多参数遥测终端机成为了当今智能化监测领域的核心工具?
- FQML_AXI_GPIO工程构建调试记录
- php think run 和springBoot的main启动的顺序,有什么相同与不同的地方
- Pandas实战100例 | 案例 55: 应用条件
- java中解码和编码出现乱码原因
- 利用策略模式与Spring Boot实现灵活的文件上传功能:多策略选择与动态实现
- 离线安装jenkins:使用rpm安装包