Matlab两个子图共用一个图例(legend函数)
发布时间:2023年12月18日
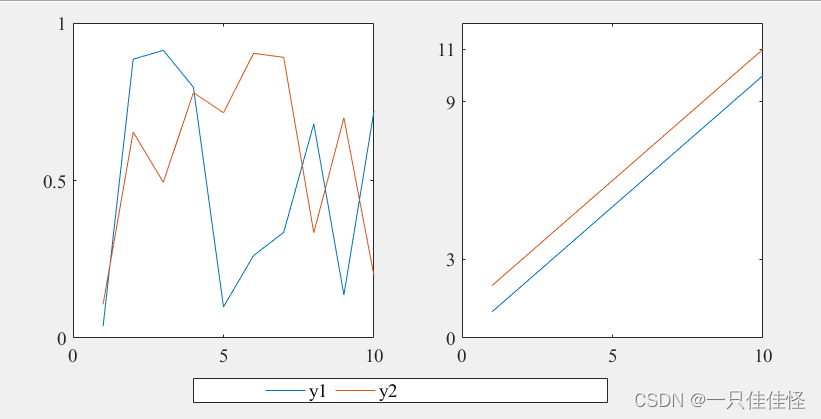
y1 = rand(10,2);
y2 = repmat(1:10,2,1)';
y2(:,2) = y2(:,1) + 1 ;
subplot(1,2,1,'position',[0.13  0.2 0.34  0.75]);
h{1} = plot(y1);
yticks([0 0.5 1])
xticks([0 5 10])
 set(gca,'FontName','Times New Roman','FontSize',14);
subplot(1,2,2,'position',[0.57  0.2 0.34 0.75]);
h{2} = plot(y2);
yticks([0 3 9 11])
xticks([0 5 10])
set(gca,'FontName','Times New Roman','FontSize',14);
hh = legend([h{1};h{2}],'y1','y2','Orientation','horizontal', 'location',[0.13,0.05,0.74,0.05],'FontName','Times New Roman','FontSize',14);
文章来源:https://blog.csdn.net/iii66yy/article/details/134986528
本文来自互联网用户投稿,该文观点仅代表作者本人,不代表本站立场。本站仅提供信息存储空间服务,不拥有所有权,不承担相关法律责任。 如若内容造成侵权/违法违规/事实不符,请联系我的编程经验分享网邮箱:chenni525@qq.com进行投诉反馈,一经查实,立即删除!
本文来自互联网用户投稿,该文观点仅代表作者本人,不代表本站立场。本站仅提供信息存储空间服务,不拥有所有权,不承担相关法律责任。 如若内容造成侵权/违法违规/事实不符,请联系我的编程经验分享网邮箱:chenni525@qq.com进行投诉反馈,一经查实,立即删除!
最新文章
- Python教程
- 深入理解 MySQL 中的 HAVING 关键字和聚合函数
- Qt之QChar编码(1)
- MyBatis入门基础篇
- 用Python脚本实现FFmpeg批量转换
- 校园导游系统-Java实现
- c++绝对值,开平方,开立方,平方,立方,n次方详细总结
- Kubernetes 学习总结(44)—— Kubernetes 1.29 中的删除、弃用和主要更改
- 数据结构和算法 - 数组
- YOLOv8 Ultralytics:使用Ultralytics框架进行定向边界框对象检测
- 红日靶场-2
- Linux 高级管理,MySQL服务器的构建与维护
- springboot使用jasypt对配置文件加密,加密数据库连接
- 系统学习Python——装饰器:函数装饰器-[对方法进行装饰:使用描述符装饰方法]
- 【解刊】2个月录用,2天见刊!国人友好,中科院分区上涨,期刊质量稳步上升!