UCharts配置个性化图表:折柱混合、条状图、渐变
发布时间:2024年01月04日
折线
效果图:
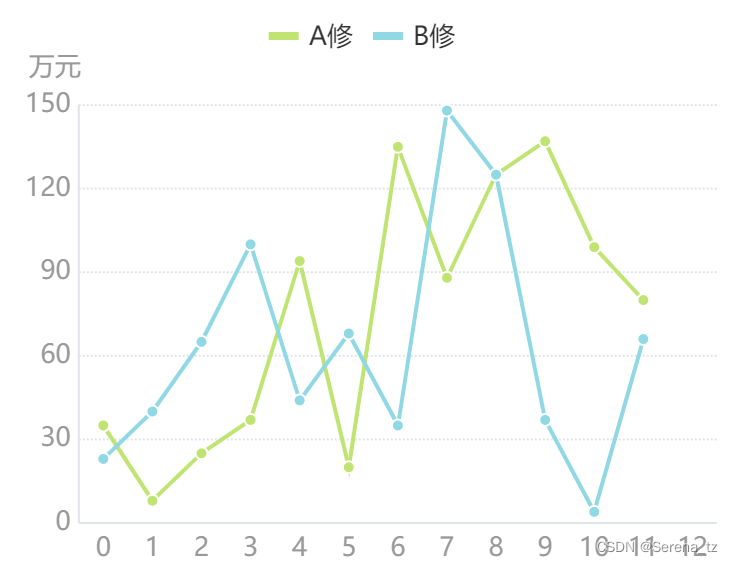
配置:
const opts = {
	color: ["#B7E55D", "#78DAE6", "#FF432A", "#FF9641", "#FFDF3D"], //颜色配置
	dataLabel: false, //不显示图表区域内数据点上方的数据文案
	legend: {
		position: "top", //图例相对画布的显示位置,可选值:'bottom','top','left','right'
		margin: 10, //图例外侧填充边距
		fontColor: "#333" //字体眼色
	},
	xAxis: {
		disableGrid: true,
		fontColor: "#999",
		axisLineColor: "#DFE3EB"
	},
	yAxis: {
		gridType: "dash",
		gridColor: "#DFE3EB",
		dashLength: 2,
		showTitle: true,
		data: [{
			title: "万元",
			fontColor: "#999",
			titleFontColor: "#999",
			axisLineColor: "#DFE3EB",
			titleOffsetY: -5,
			titleOffsetX: -12
		}]
	},
	extra: {
		line: {
			type: "straight"
		},
		tooltip: { //提示窗
			showArrow: false, //是否显示箭头
			borderRadius: 4, //圆角大小
			bgOpacity: 0.6, //背景色透明度
		}
	}
}
圆滑折线
效果图:
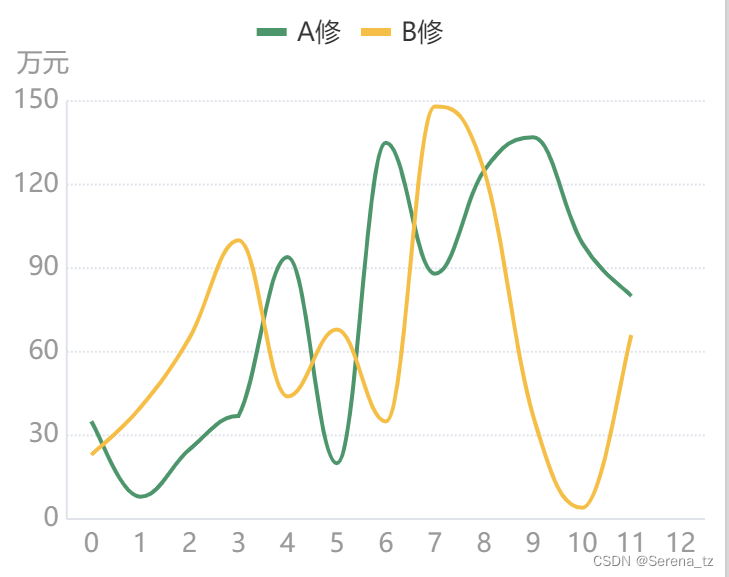
配置:
const opts = {
	color: ["#B7E55D", "#78DAE6", "#FF432A", "#FF9641", "#FFDF3D"], //颜色配置
	dataLabel: false, //不显示图表区域内数据点上方的数据文案
	dataPointShape: false,
	legend: {
		position: "top", //图例相对画布的显示位置,可选值:'bottom','top','left','right'
		margin: 10, //图例外侧填充边距
		fontColor: "#333" //字体眼色
	},
	xAxis: {
		disableGrid: true,
		fontColor: "#999",
		axisLineColor: "#DFE3EB"
	},
	yAxis: {
		gridType: "dash",
		gridColor: "#DFE3EB",
		dashLength: 2,
		showTitle: true,
		data: [{
			title: "万元",
			fontColor: "#999",
			titleFontColor: "#999",
			axisLineColor: "#DFE3EB",
			titleOffsetY: -5,
			titleOffsetX: -12
		}]
	},
	extra: {
		line: {
			type: "curve"
		},
		tooltip: { //提示窗
			showArrow: false, //是否显示箭头
			borderRadius: 4, //圆角大小
			bgOpacity: 0.6, //背景色透明度
		}
	}
}
柱状图
效果图:
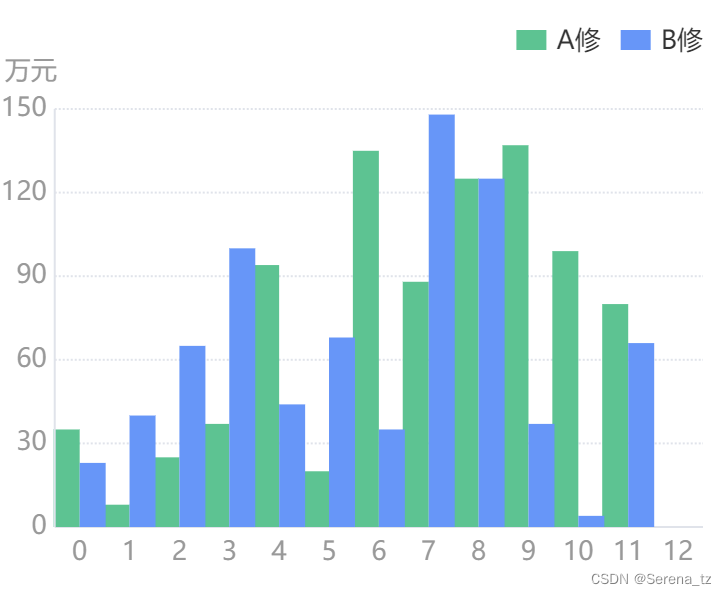
配置:
const opts = {
	color: ["#1CC68E", "#5898FF"],
	dataLabel: false, //不显示图表区域内数据点上方的数据文案
	legend: {
		position: "top", //图例相对画布的显示位置,可选值:'bottom','top','left','right'
		float:"right",
		margin: 10, //图例外侧填充边距
		fontColor: "#333" //字体眼色
	},
	xAxis: {
		disableGrid: true,
		fontColor: "#999",
		axisLineColor: "#DFE3EB"
	},
	yAxis: {
		gridType: "dash",
		gridColor: "#DFE3EB",
		dashLength: 2,
		showTitle: true,
		data: [{
			title: "万元",
			fontColor: "#999",
			titleFontColor: "#999",
			axisLineColor: "#DFE3EB",
			titleOffsetY: -5,
			titleOffsetX: -12
		}]
	},
	extra: {
		tooltip: { //提示窗
			showArrow: false, //是否显示箭头
			borderRadius: 4, //圆角大小
			bgOpacity: 0.6, //背景色透明度
		}
	}
}
饼图
效果图:
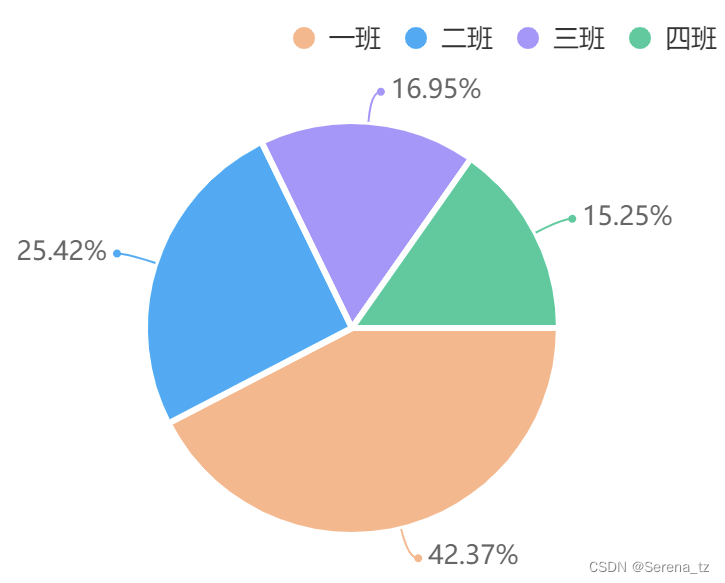
配置:
const opts = {
	color: ["#FEB587", "#21ADF9", "#A896FE ", "#1FCC9A"],
	legend: {
		position: "top", //图例相对画布的显示位置,可选值:'bottom','top','left','right'
		float: "right",
		margin: 10, //图例外侧填充边距
		fontColor: "#333" //字体眼色
	},
	extra: {
		pie: {

		},
		tooltip: { //提示窗
			showArrow: false, //是否显示箭头
			borderRadius: 4, //圆角大小
			bgOpacity: 0.6, //背景色透明度
		}
	}
}
条状图
效果图:
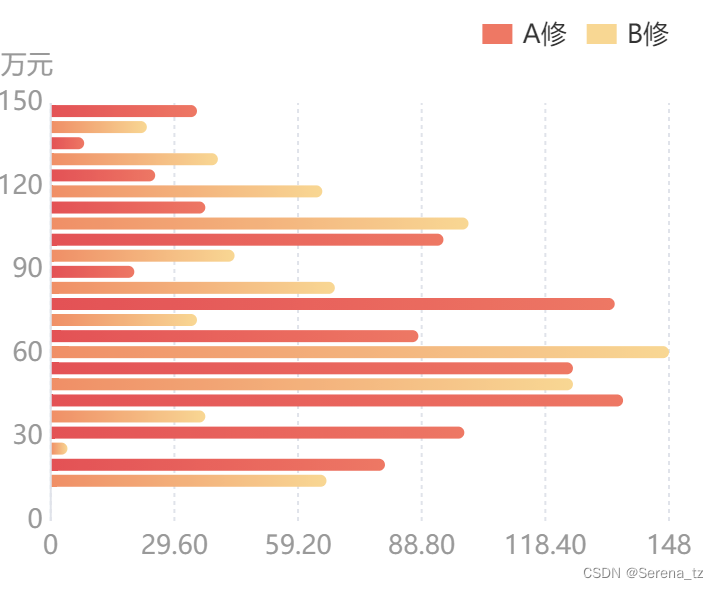
配置:
const opts = {
	color: ["#FF6F5D", "#FFD589"],
	dataLabel: false, //不显示图表区域内数据点上方的数据文案
	legend: {
		position: "top", //图例相对画布的显示位置,可选值:'bottom','top','left','right'
		float:"right",
		margin: 10, //图例外侧填充边距
		fontColor: "#333" //字体眼色
	},
	xAxis: {
		axisLine: false,
		fontColor: "#999",
		gridType: "dash",
		gridColor: "#DFE3EB",
	},
	yAxis: {
		gridType: "dash",
		gridColor: "#DFE3EB",
		dashLength: 2,
		showTitle: true,
		data: [{
			title: "万元",
			fontColor: "#999",
			titleFontColor: "#999",
			axisLineColor: "#DFE3EB",
			titleOffsetY: -5,
			titleOffsetX: -12
		}]
	},
	extra: {
		bar: {
			type: "group",
			width: 12,
			linearType: "custom",
			customColor:["#F64250", "#FF885D"],
			barBorderCircle: true,
			seriesGap: 2,
			categoryGap: 2
		},
		tooltip: { //提示窗
			showArrow: false, //是否显示箭头
			borderRadius: 4, //圆角大小
			bgOpacity: 0.6, //背景色透明度
		}
	}
}
折柱混合渐变
效果图:
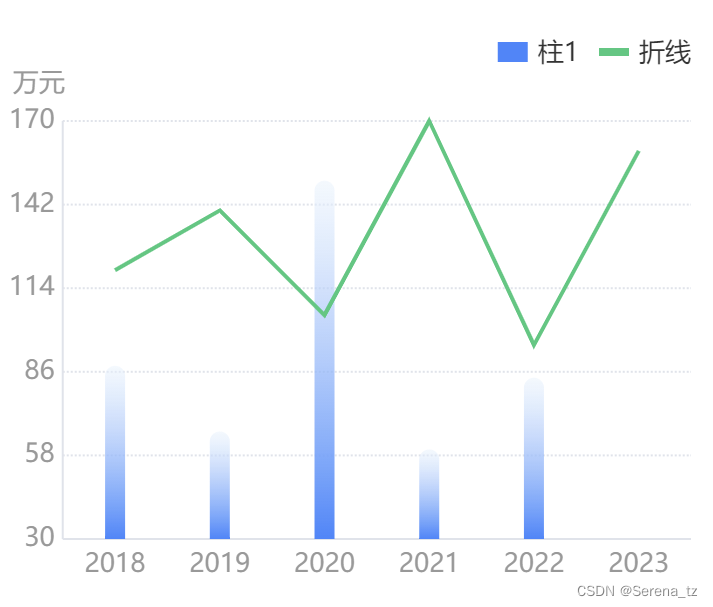
配置:
const opts = {
	color: ["#3D87FF", "#31C97C"],
	dataLabel: false, //不显示图表区域内数据点上方的数据文案
	legend: {
		position: "top", //图例相对画布的显示位置,可选值:'bottom','top','left','right'
		float: "right",
		margin: 10, //图例外侧填充边距
		fontColor: "#333" //字体眼色
	},
	xAxis: {
		disableGrid: true,
		fontColor: "#999",
		axisLineColor: "#DFE3EB"
	},
	yAxis: {
		gridType: "dash",
		gridColor: "#DFE3EB",
		dashLength: 2,
		showTitle: true,
		data: [{
			title: "万元",
			fontColor: "#999",
			titleFontColor: "#999",
			axisLineColor: "#DFE3EB",
			titleOffsetY: -5,
			titleOffsetX: -12
		}]
	},
	extra: {
		mix: {
			column: {
				type: "group",
				width: 10,
				seriesGap: 5,
				linearOpacity: 0.5,
				barBorderCircle: true,
				linearType: "custom",
				customColor: [
					"#E7F2FD"
				]
			}
		},
		tooltip: { //提示窗
			showArrow: false, //是否显示箭头
			borderRadius: 4, //圆角大小
			bgOpacity: 0.6, //背景色透明度
		}
	}
}
文章来源:https://blog.csdn.net/Serena_tz/article/details/135388089
本文来自互联网用户投稿,该文观点仅代表作者本人,不代表本站立场。本站仅提供信息存储空间服务,不拥有所有权,不承担相关法律责任。 如若内容造成侵权/违法违规/事实不符,请联系我的编程经验分享网邮箱:chenni525@qq.com进行投诉反馈,一经查实,立即删除!
本文来自互联网用户投稿,该文观点仅代表作者本人,不代表本站立场。本站仅提供信息存储空间服务,不拥有所有权,不承担相关法律责任。 如若内容造成侵权/违法违规/事实不符,请联系我的编程经验分享网邮箱:chenni525@qq.com进行投诉反馈,一经查实,立即删除!
最新文章
- Python教程
- 深入理解 MySQL 中的 HAVING 关键字和聚合函数
- Qt之QChar编码(1)
- MyBatis入门基础篇
- 用Python脚本实现FFmpeg批量转换
- 准备好通过 “Breakin’ B.I.G.” 在嘻哈音乐界大放异彩吧!
- 为什么项目管理工具需要项目财务信息?
- 【精选】基于深度学习网络的车辆行人检测系统
- 硬件基础-电阻
- C语言基础入门48篇_00_如何学习一门新语言(针对初学者)
- git子模块使用关键命令
- 使用udp协议可以给自己的电脑主机发送消息
- ubuntu系统,开机完成后,会自动进入一个账号,我想不要如此,让我可以选择登陆的账号,怎么做
- 腾讯云com域名首年价格
- Linux常用命令02(解压、输出重定向、vim编辑、用户组、用户、权限,时间)