echart3D地图使用
发布时间:2024年01月22日
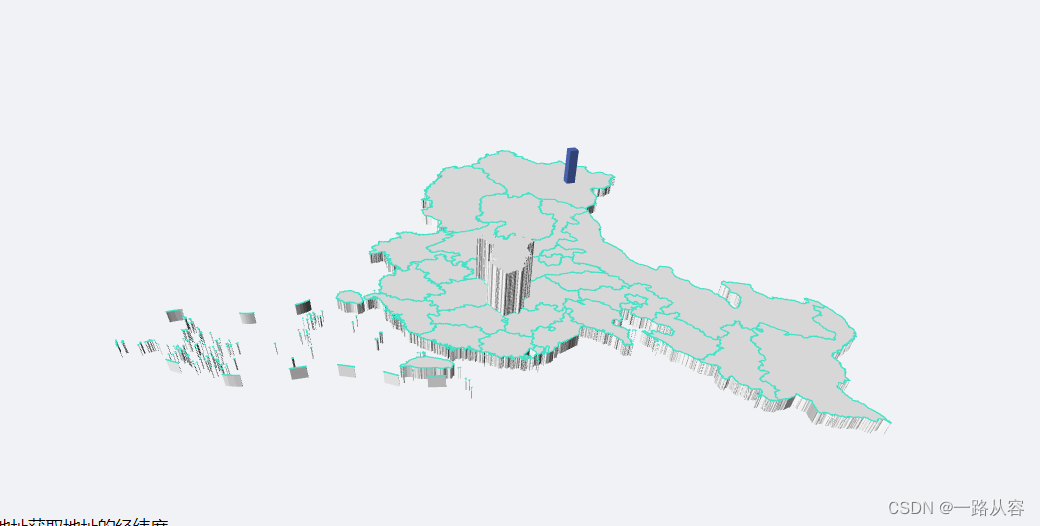
由于项目需求,需要实现3D全国地图,并且在3D地图上通过3D柱状图显示各个区域的数据,并鼠标悬浮该区域的时候,需要实现该省份区域模块整体向上移动的特效
实现效果大致如下,细节需要各位同学自行调整了

需要安装echarts插件和echarts-gl插件,引入的request 就是封装的axios
可以直接换成axios
<template>
	<div>
		<div style="width: 800px; height: 400px">
			<div style="height: 100%" ref="homeChartRef"></div>
		</div>
	</div>
</template>
<script lang="ts" setup>
import * as echarts from 'echarts'
import 'echarts-gl'
import request from '/@/utils/request'
const homeChartRef = ref()
const initChar = () => {
	nextTick(async () => {
		let myChart = echarts.init(homeChartRef.value, '')
			//  https://datav.aliyun.com/portal/school/atlas/area_selector#&lat=33.521903996156105&lng=104.29849999999999&zoom=4
			// 上面地址建议收藏,可以自行获取省市区的地图数据
			// 该接口地址为https://geo.datav.aliyun.com/areas_v3/bound/100000_full.json
			// 本地调用如果不通,可以自行使用代理解决
		const response = (await request({
			url: `/areas_v3/bound/geojson?code=100000_full`,
			method: 'get',
		})) as any
		console.log(response, 'response')

		echarts.registerMap('cictMap', response)
		const data = [
			['87.63', '43.79', 47, '新疆维吾尔自治区'],
			['114.28', '30.63', 40, '湖北省'],
		]
		let option = {
			title: {
				text: '',
				left: 'center',
				textStyle: {
					fontSize: 20,
					color: 'rgb(85,85,85)',
				},
			},
			geo3D: {
				map: 'cictMap',
				regionHeight: 2,
				itemStyle: {
					borderColor: '#43e2c7',
					borderWidth: 1,
				},
				emphasis: {
					label: {
						show: true,
						color: 'red',
					},
				},
			},
			series: [
				{
					type: 'bar3D',
					coordinateSystem: 'geo3D',
					shading: 'lambert',
					minHeight: 1,
					itemStyle: {
						normal: {
							label: {
								show: false,
							},
						},
						emphasis: {
							label: {
								show: false,
							},
						},
					},
					data: data,
				},
			],
		}
		// 使用刚指定的配置项和数据显示图表。
		myChart.setOption(option)
		myChart.on('mouseover', function (params) {
			var currentOption = myChart.getOption() as any
			//  以下代码是重点,官网文档上的属性是regionHeight,该属性无效需要改为height,大家可以去提
			currentOption.geo3D[0].regions = [
				{
					name: params.data[3],
					height: 10,
				},
			]
			myChart.setOption(currentOption)
		})
	})
}
onMounted(() => {
	initChar()
})
</script>
文章来源:https://blog.csdn.net/qq_41042845/article/details/135747104
本文来自互联网用户投稿,该文观点仅代表作者本人,不代表本站立场。本站仅提供信息存储空间服务,不拥有所有权,不承担相关法律责任。 如若内容造成侵权/违法违规/事实不符,请联系我的编程经验分享网邮箱:chenni525@qq.com进行投诉反馈,一经查实,立即删除!
本文来自互联网用户投稿,该文观点仅代表作者本人,不代表本站立场。本站仅提供信息存储空间服务,不拥有所有权,不承担相关法律责任。 如若内容造成侵权/违法违规/事实不符,请联系我的编程经验分享网邮箱:chenni525@qq.com进行投诉反馈,一经查实,立即删除!
最新文章
- Python教程
- 深入理解 MySQL 中的 HAVING 关键字和聚合函数
- Qt之QChar编码(1)
- MyBatis入门基础篇
- 用Python脚本实现FFmpeg批量转换
- 【秣厉科技】LabVIEW工具包——二维码(QRCode)
- 众多企业做私域的普遍困扰,微信管理工具帮助企业打造私域流量
- 【12.20】转行小白历险记 登录+注册页
- 性能测试之Locust(完整版)
- 数据库客户案例:每个物种都需要一个数据库!
- 常用网安渗透工具及命令(扫目录、解密爆破、漏洞信息搜索)
- uniapp、微信小程序类似mui中的chat(聊天窗口)
- C++多线程学习[二]:线程的传参以及传参的一些坑
- Node.js 路由
- Intellij-idea 如何编译maven工程