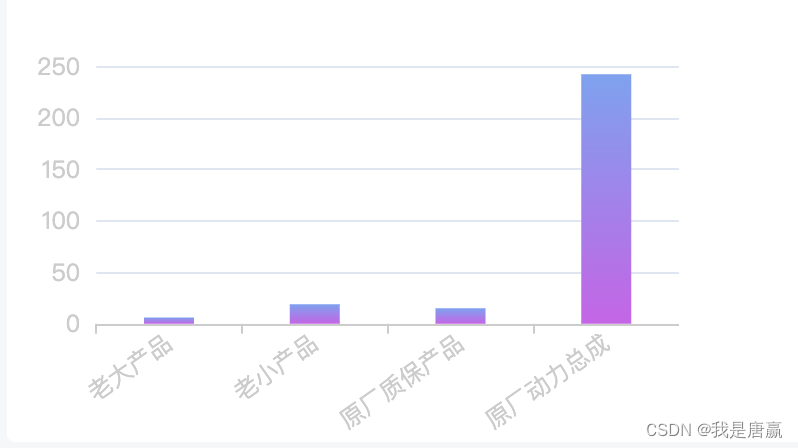
echarts 实现x轴文字倾斜显示
发布时间:2023年12月20日
显示效果

关键代码
        xAxis: {
            axisLabel: {
                show: true,
                rotate: 35,//35度角倾斜显示
            },
        },
完全代码
var optSaleType = {
        title: {
            text: '',
            textStyle: {
                color: '#000',
                fontSize: 14
            }
        },
        tooltip: {},
        grid: {
            left: '0',
            right: '0',
            bottom: '0',
            containLabel: true,

        },
        xAxis: {
            axisLabel: {
                show: true,
                interval: 0,//横轴信息全部显示
                rotate:  35,//-30度角倾斜显示
                textStyle: {
                    rich: {}
                }
            },
            data: data.names,
            axisLine: {
                lineStyle: {
                    color: '#cccccc'
                }
            },

        },
        yAxis: {
            type: 'value',
            axisLine: {
                lineStyle: {
                    color: '#cccccc'
                }
            },
            splitLine: {
                lineStyle: {
                    type:  'solid' ,
                    color:  '#cccccc' , //左边线的颜色
                    width: '1' //坐标线的宽度
                }
            },


        },
        series: [{
            type: 'bar',
            data: data.counts,
            barMaxWidth: 25,
            color: '#f3795b',
            itemStyle: {
                normal: {
                    barBorderRadius:[5, 5 , 0, 0],
                    color: function (params) {
                        var colorList = [
                            ['#90bfe5','#4178e5'],
                            ['#7bf1b6','#3dc886'],
                        ];
                        if (level_saletype > 1) {
                            colorList = [
                                ['#fab2ff','#9f7ef4'],
                                ['#ffeb90','#ffe25c'],
                                ['#fe6f88','#ffd3a5'],
                            ];
                        }
                        var index = params.dataIndex;
                        if (params.dataIndex >= colorList.length) {
                            index = params.dataIndex - colorList.length;
                        }
                        return new echarts.graphic.LinearGradient(0, 0, 1, 1,
                            [{
                                offset: 0,
                                color: colorList[index][0]
                            },
                                {
                                    offset: 1,
                                    color: colorList[index][1]
                                }
                            ]);
                    }
                },
            },

        }]
    };
    chartSaleType.setOption(optSaleType);
完全代码整体展示只作参考作用,只用关心核心代码即可
文章来源:https://blog.csdn.net/gdgztt/article/details/135086039
本文来自互联网用户投稿,该文观点仅代表作者本人,不代表本站立场。本站仅提供信息存储空间服务,不拥有所有权,不承担相关法律责任。 如若内容造成侵权/违法违规/事实不符,请联系我的编程经验分享网邮箱:chenni525@qq.com进行投诉反馈,一经查实,立即删除!
本文来自互联网用户投稿,该文观点仅代表作者本人,不代表本站立场。本站仅提供信息存储空间服务,不拥有所有权,不承担相关法律责任。 如若内容造成侵权/违法违规/事实不符,请联系我的编程经验分享网邮箱:chenni525@qq.com进行投诉反馈,一经查实,立即删除!
最新文章
- Python教程
- 深入理解 MySQL 中的 HAVING 关键字和聚合函数
- Qt之QChar编码(1)
- MyBatis入门基础篇
- 用Python脚本实现FFmpeg批量转换
- 深入了解鸿鹄工程项目管理系统源码:功能清单与项目模块的深度解析
- 学校和老师如何制作自己免费的成绩查询系统
- Visual Studio离线版本下载安装
- S2-10 ESP-IDF开发 : Wi-Fi
- SpringBoot Redis入门(三)——自定义MyCacheable缓存注解,实现对返回结果缓存
- iPhone忘记密码怎么恢复出厂设置?这个方法收藏好!
- Python基础07-模块
- Web基础与http协议
- 去除微信小程序里button的边框
- leetcode hot 100