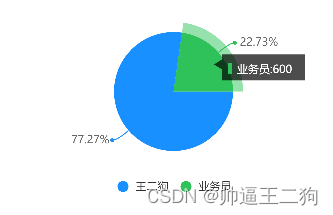
uni-app 饼状图
发布时间:2023年12月27日
大体样式为这种:

一、下载组件:
秋云 ucharts echarts 高性能跨全端图表组件 - DCloud 插件市场
下载好组件之后用import?导入到项目中
二、代码部分:
<view class="chartsMain" style="width: 99.9%;">
	<canvas canvas-id="canvasPie" id="canvasPie" class="charts" @touchstart="touchPie">
    </canvas>
</view>
import uCharts from "@/uni_modules/u-charts/u-charts.js";
var _self;
var canvaPie = null;
export default {
data() {
return {
pixelRatio: 1,
cWidth: '',
cHeight: '',
// 饼状图
"Pie": {
"series": []
},
}
},
onLoad() {
//页面加载
_self = this;
this.cWidth = uni.upx2px(750);
this.cHeight = uni.upx2px(420);
},
methods: {
//在获取后端数据时调用this.getServerData()
getServerData() {
_self.showPie("canvasPie", this.Pie);
},
touchPie(e) {
//点击扇形显示信息
canvaPie.showToolTip(e, {
format: function(item) {
console.log(item)
return item.name + ':' + item.data
//注意!需要显示的字段名必须为'name'和'data'
}
});
},
// 饼状图
showPie(canvasId, chartData) {
canvaPie = new uCharts({
$this: _self,
canvasId: canvasId,
type: 'pie',
fontSize: 11,
legend: true,
background: '#FFFFFF',
pixelRatio: _self.pixelRatio,
series: _self.Pie.series,
animation: true,
width: _self.cWidth * _self.pixelRatio,
height: _self.cHeight * _self.pixelRatio,
dataLabel: true,
extra: {
pie: {
lableWidth: 15
}
},
});
console.log(this.Pie.series)
},
}
}.chartsMain {
width: 750rpx;
height: 450rpx;
padding-top: 15rpx;
background: #fff;
margin-bottom: 24rpx;
border-top: 2rpx solid #f2f2f2;
.charts {
width: 750rpx;
height: 450rpx;
box-sizing: border-box;
}
}
文章来源:https://blog.csdn.net/MrjieQ/article/details/135194796
本文来自互联网用户投稿,该文观点仅代表作者本人,不代表本站立场。本站仅提供信息存储空间服务,不拥有所有权,不承担相关法律责任。 如若内容造成侵权/违法违规/事实不符,请联系我的编程经验分享网邮箱:chenni525@qq.com进行投诉反馈,一经查实,立即删除!
本文来自互联网用户投稿,该文观点仅代表作者本人,不代表本站立场。本站仅提供信息存储空间服务,不拥有所有权,不承担相关法律责任。 如若内容造成侵权/违法违规/事实不符,请联系我的编程经验分享网邮箱:chenni525@qq.com进行投诉反馈,一经查实,立即删除!
最新文章
- Python教程
- 深入理解 MySQL 中的 HAVING 关键字和聚合函数
- Qt之QChar编码(1)
- MyBatis入门基础篇
- 用Python脚本实现FFmpeg批量转换
- 一起玩儿物联网人工智能小车(ESP32)——26. 舵机的使用方法
- Linux软链接的创建,删除,修改
- 11、NumPy 花式索引与索引技巧
- MATLAB FFT ILA
- C++学习笔记--结构体
- 网上申请的联通流量卡需要上传身份证信息,这是怎么回事?
- 数据结构二叉树--堆(数据结构实现和堆排序的一种实现)
- 计算机网络安全问题的影响因素和防护措施—参考论文
- 宠物空气净化器哪个牌子好?实惠的猫用空气净化器牌子推荐
- odoo17后台启动过程3——三种server