一个超强的 python GUI 库
发布时间:2023年12月18日
今天给大家分享一个超强的 python 库,旨在轻松快速地创建简单的图形用户界面。
它构建在标准 Python GUI 工具包 tkinter 之上,但为创建 GUI?提供了更简单、更直观的界面。
它具有如下特点。
-
简单性
PySimpleGUI 通过简化的接口降低了创建 GUI 的复杂性。它允许开发者使用简洁的代码来创建窗口、按钮、文本框等常见的 GUI 元素。
-
支持多个 GUI 框架
虽然默认情况下 PySimpleGUI 使用 Tkinter 作为其后端,但它也支持其他 Python GUI 框架,如 Qt、WxPython 和 Web(通过 Remi)。这为开发者提供了灵活性,可以根据需要选择合适的后端。
-
灵活性
PySimpleGUI 与多个平台兼容,包括 Windows、Mac 和 Linux,并且支持 Python 2 和 Python 3。
-
自定义和样式
尽管 PySimpleGUI 专注于简化 GUI 创建过程,但它依然提供了足够的选项来自定义界面的外观和行为。
-
丰富的文档和示例
PySimpleGUI 拥有详细的文档和大量的示例代码,这极大地帮助了新用户的学习和使用。
总之,PySimpleGUI 是使用 Python 开发 GUI 应用程序的绝佳选择。它易于使用、灵活且功能强大,使其成为初学者和经验丰富的开发人员的理想选择。无论你想要创建一个简单的应用程序还是一个更复杂、功能丰富的程序,PySimpleGUI 都能满足你入门所需的一切。
库的安装
可以直接使用 pip 进行安装。
pip?install?PySimpleGUI简单的输入对话框
在此示例中,我们创建一个简单的输入对话框,询问用户的姓名。你可以在输入字段中输入你的姓名,然后单击 “确定” 按钮以获得友好的问候。
import PySimpleGUI as sg
layout=[[sg.Text('Enter?your?name:'),sg.InputText()],[sg.Button('Ok'),sg.Button('Cancel')]]
window=sg.Window('My?Window',layout)
event,values=window.Read()
if event=='Ok':
    sg.Popup('Hello'+values[0]+'!')
window.Close()
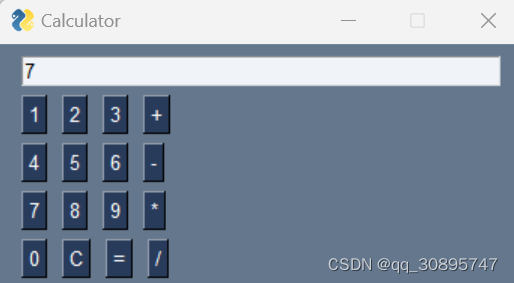
简单计算器
在此示例中,我们创建一个简单的计算器,可以对数字进行加、减、乘、除操作。
import PySimpleGUI as sg
layout=[[sg.InputText(key='input')],
        [sg.Button('1'),sg.Button('2'),sg.Button('3'),sg.Button('+')],
        [sg.Button('4'),sg.Button('5'),sg.Button('6'),sg.Button('-')],
        [sg.Button('7'),sg.Button('8'),sg.Button('9'),sg.Button('*')],
        [sg.Button('0'),sg.Button('C'),sg.Button('='),sg.Button('/')]]
window=sg.Window('Calculator',layout)
equation=''
while True:
    event,values=window.Read()
    if event == 'C':
        equation=''
        window['input'].Update(equation)
    elif event=='=':
        try:
            print(equation)
            result=eval(equation)
            window['input'].Update(result)
        except:
            result='Error'
            equation=''
            window['input'].Update(equation)
    elif event in ['+','-','*','/']:
        equation+=event
        window['input'].Update(equation)
    else:
        equation+=event
        window['input'].Update(equation)
window.Close()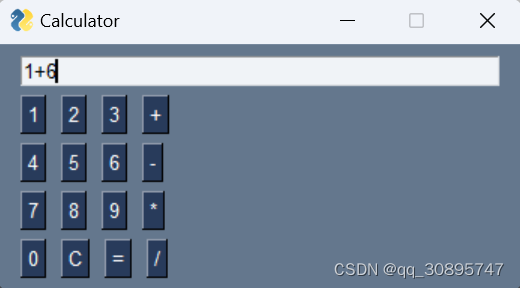
显示 matplotlib 动态图
import?PySimpleGUI?as?sg
from?random?import?randint
from?matplotlib.backends.backend_tkagg?import?FigureCanvasTkAgg,?FigureCanvasAgg
from?matplotlib.figure?import?Figure
#?Yet?another?usage?of?MatPlotLib?with?animations.
def?draw_figure(canvas,?figure,?loc=(0,?0)):
????figure_canvas_agg?=?FigureCanvasTkAgg(figure,?canvas)
????figure_canvas_agg.draw()
????figure_canvas_agg.get_tk_widget().pack(side='top',?fill='both',?expand=1)
????return?figure_canvas_agg
def?main():
????NUM_DATAPOINTS?=?10000
????#?define?the?form?layout
????layout?=?[[sg.Text('Animated?Matplotlib',?size=(40,?1),
????????????????justification='center',?font='Helvetica?20')],
??????????????[sg.Canvas(size=(640,?480),?key='-CANVAS-')],
??????????????[sg.Text('Progress?through?the?data')],
??????????????[sg.Slider(range=(0,?NUM_DATAPOINTS),?size=(60,?10),
????????????????orientation='h',?key='-SLIDER-')],
??????????????[sg.Text('Number?of?data?points?to?display?on?screen')],
???????????????[sg.Slider(range=(10,?500),?default_value=40,?size=(40,?10),
????????????????????orientation='h',?key='-SLIDER-DATAPOINTS-')],
??????????????[sg.Button('Exit',?size=(10,?1),?pad=((280,?0),?3),?font='Helvetica?14')]]
????#?create?the?form?and?show?it?without?the?plot
????window?=?sg.Window('Demo?Application?-?Embedding?Matplotlib?In?PySimpleGUI',
????????????????layout,?finalize=True)
????canvas_elem?=?window['-CANVAS-']
????slider_elem?=?window['-SLIDER-']
????canvas?=?canvas_elem.TKCanvas
????#?draw?the?initial?plot?in?the?window
????fig?=?Figure()
????ax?=?fig.add_subplot(111)
????ax.set_xlabel("X?axis")
????ax.set_ylabel("Y?axis")
????ax.grid()
????fig_agg?=?draw_figure(canvas,?fig)
????#?make?a?bunch?of?random?data?points
????dpts?=?[randint(0,?10)?for?x?in?range(NUM_DATAPOINTS)]
????for?i?in?range(len(dpts)):
????????event,?values?=?window.read(timeout=10)
????????if?event?in?('Exit',?None):
????????????exit(69)
????????slider_elem.update(i)???????#?slider?shows?"progress"?through?the?data?points
????????ax.cla()????????????????????#?clear?the?subplot
????????ax.grid()???????????????????#?draw?the?grid
????????data_points?=?int(values['-SLIDER-DATAPOINTS-'])?#?draw?this?many?data?points?(on?next?line)
????????ax.plot(range(data_points),?dpts[i:i+data_points],??color='purple')
????????fig_agg.draw()
????window.close()
if?__name__?==?'__main__':
????main()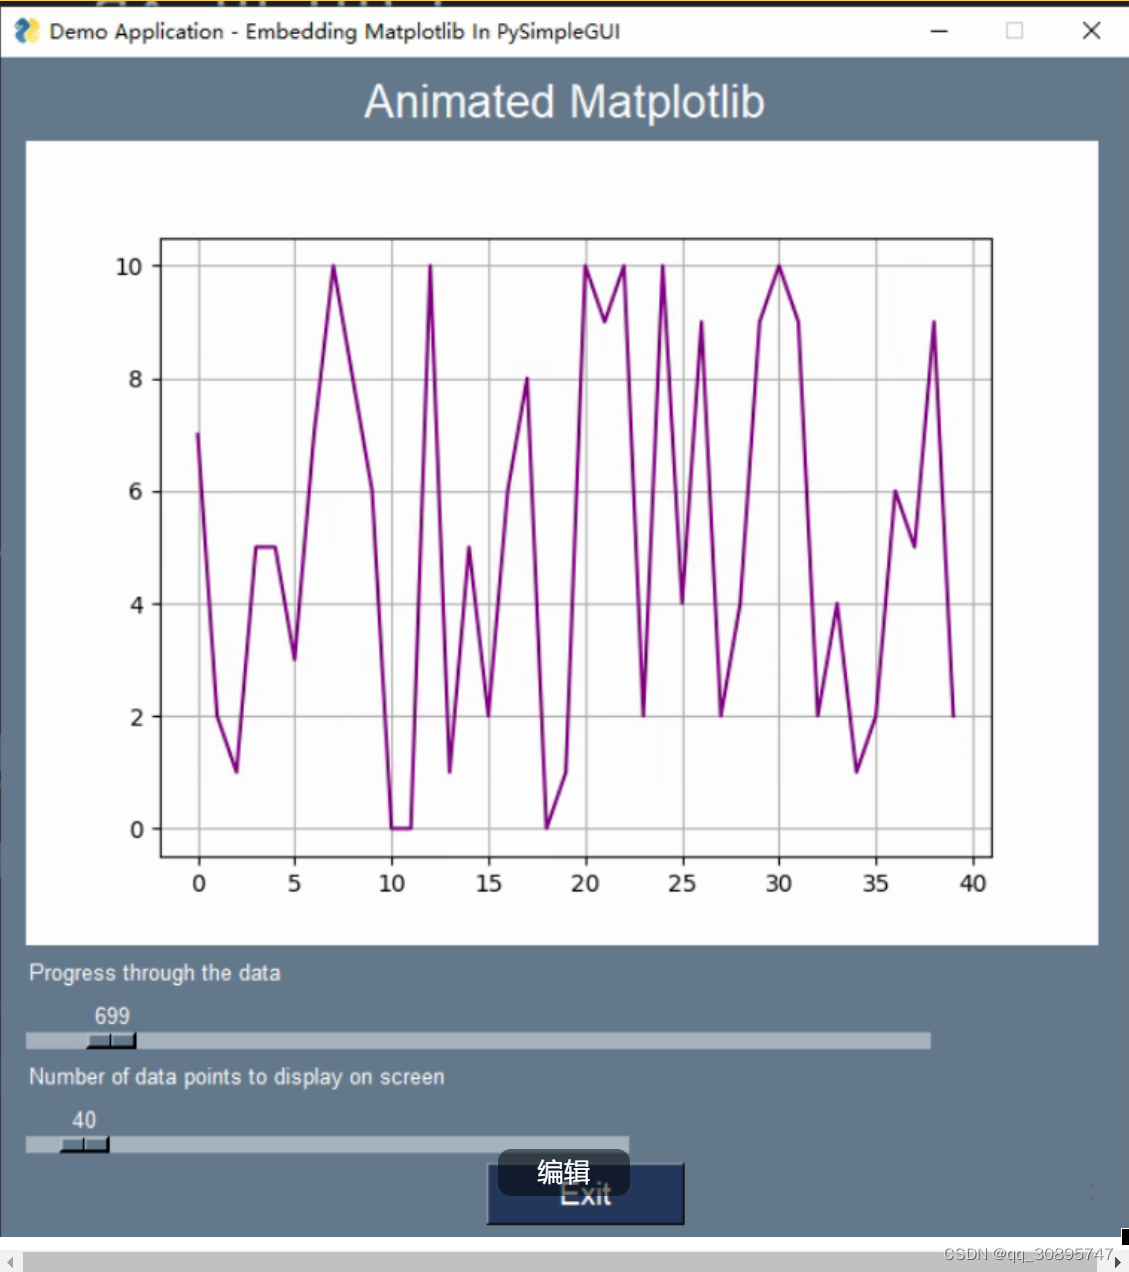 ?
?
文章来源:https://blog.csdn.net/qq_30895747/article/details/135065574
本文来自互联网用户投稿,该文观点仅代表作者本人,不代表本站立场。本站仅提供信息存储空间服务,不拥有所有权,不承担相关法律责任。 如若内容造成侵权/违法违规/事实不符,请联系我的编程经验分享网邮箱:chenni525@qq.com进行投诉反馈,一经查实,立即删除!
本文来自互联网用户投稿,该文观点仅代表作者本人,不代表本站立场。本站仅提供信息存储空间服务,不拥有所有权,不承担相关法律责任。 如若内容造成侵权/违法违规/事实不符,请联系我的编程经验分享网邮箱:chenni525@qq.com进行投诉反馈,一经查实,立即删除!
最新文章
- Python教程
- 深入理解 MySQL 中的 HAVING 关键字和聚合函数
- Qt之QChar编码(1)
- MyBatis入门基础篇
- 用Python脚本实现FFmpeg批量转换
- 使用OceanBase必知的十件事
- 第2篇最强Redis面试八股文
- apk共享
- LeetCode 447. 回旋镖的数量,枚举+哈哈希
- 反射UnityEditor.GameView设置GamePlayMode分辨率
- ELK的搭建—Elasticsearch-8.11.3的安装及集群的搭建
- 抖音蓝V怎么认证??
- 新手必看:腾讯云服务器购买详细图文教程
- STM32TIM定时器PWM输出比较(适用于通用,高级定时器)
- MySQL练习-DDL语法练习