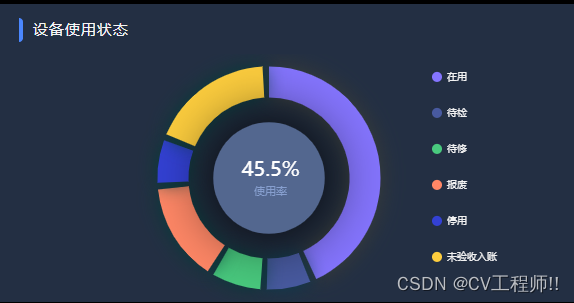
VUE3使用Echarts图表
发布时间:2023年12月18日
前言: 基本可以按照Echarts官网的描述来使用,Echart官网
第一步: 安装
npm install echarts --save
第二步: 使用
//页面定义容器
   <div class="content-box echarts-box">
      <!-- 图表 定义ref 方便获取通过 ref 属性获取元素 -->
              <div class="echarts-one" ref="chartmain1">

              </div>
    </div>
//引入echarts 并定义ref变量
import * as echarts from 'echarts'

// 图表1
const chartmain1 = ref(null)
//定义图表方法
function funechart1(){
       //挂载
      const myChart = echarts.init(chartmain1.value);

      let option = {
        backgroundColor: '#232f43',
        color: ['rgba(150, 45, 255, 1)', 'rgba(236, 236, 236, 1)'],
        tooltip: {
            trigger: 'item',
            axisPointer: {
                type: 'shadow',
            },
            formatter: function (param) {
                let str = '';
                let c = (param['value'] / sum) * 100; // 算出百分比
                c = c.toFixed(2);
                str = str + c + '%';
                return param.name + ': ' + param['value'] + '/' + str;
            },
        },
        //.......定义你的数据 以及样式
       }
        //设置 ECharts 图表的配置项。option 对象包含了图表的各种配置信息
        myChart.setOption(option);
        // 设置实例参数 图标自适应
        window.onresize = () => {
            myChart.resize();
        };
}
(如果是固定数据的话)然后将图表方法塞入
onMounted(() => {
    initEchartsFn()
})
? ? 如果是请求完数据 然后将数据塞入图表中 (就是需要调接口请求数据拿到数据后再渲染)?
在获取到数据后再.then回调中延迟执行 不然会加载不出来
setTimeout(() => {

? ? ? ? ? ? // 子任务问题数排名

? ? ? ? ? ? zitaskquestionfun()

? ? ? ? }, 300);
文章来源:https://blog.csdn.net/m0_65607651/article/details/135067978
本文来自互联网用户投稿,该文观点仅代表作者本人,不代表本站立场。本站仅提供信息存储空间服务,不拥有所有权,不承担相关法律责任。 如若内容造成侵权/违法违规/事实不符,请联系我的编程经验分享网邮箱:chenni525@qq.com进行投诉反馈,一经查实,立即删除!
本文来自互联网用户投稿,该文观点仅代表作者本人,不代表本站立场。本站仅提供信息存储空间服务,不拥有所有权,不承担相关法律责任。 如若内容造成侵权/违法违规/事实不符,请联系我的编程经验分享网邮箱:chenni525@qq.com进行投诉反馈,一经查实,立即删除!
最新文章
- Python教程
- 深入理解 MySQL 中的 HAVING 关键字和聚合函数
- Qt之QChar编码(1)
- MyBatis入门基础篇
- 用Python脚本实现FFmpeg批量转换
- 在win11中安装“mingw-w64-gcc-13.2-stable-r40”
- 【Mongo】Java操作MongoDB
- 常用python代码大全-使用Python的requests模块发送HTTP请求
- 算法回忆录——排序
- if else else if 的使用及其嵌套
- TensorFlow 模型中的回调函数与损失函数
- SpringBoot从数据库读取数据数据源配置信息,动态切换数据源
- react的redux和router的使用案例讲解
- ssm基于Java Web的在线电影票购买系统的设计与实现论文
- 洛谷P1433——最优性剪枝与位运算状压dp