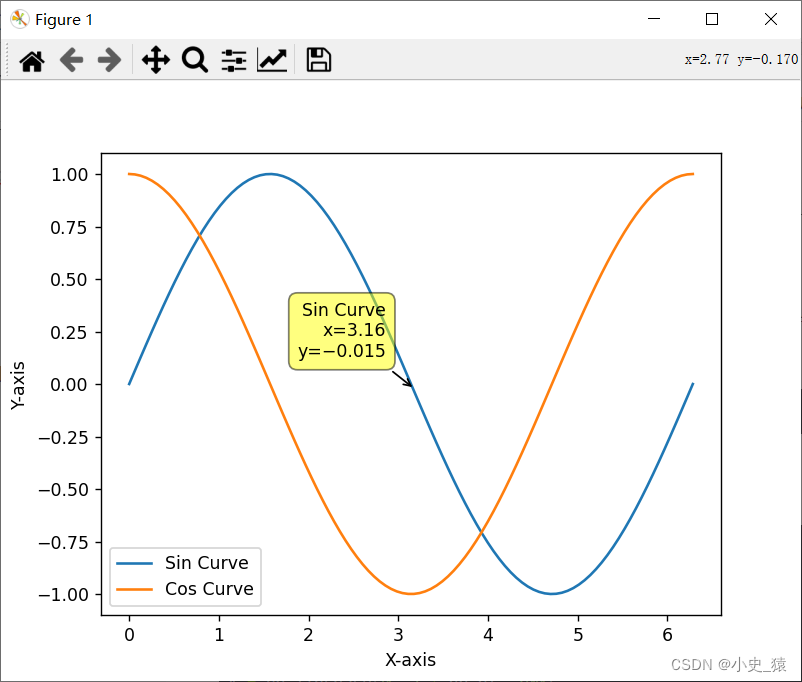
使用 Matplotlib 和 mplcursors 创建交互式数据可视化,鼠标悬停动态显示数据
发布时间:2023年12月17日
在本博客中,我们将探讨如何使用 Matplotlib(Python 中流行的绘图库)和 mplcursors(一个为 Matplotlib 图表添加交互式数据光标的库)创建交互式数据可视化。
效果图:


环境设置
首先,请确保已安装 Matplotlib 和 mplcursors。你可以使用以下命令安装它们:
pip install matplotlib mplcursors
代码
import matplotlib.pyplot as plt
import numpy as np
import mplcursors

# 创建数据
x = np.linspace(0, 2 * np.pi, 100)
y1 = np.sin(x)
y2 = np.cos(x)

# 绘制曲线图
fig, ax = plt.subplots()
line1, = ax.plot(x, y1, label='正弦曲线')
line2, = ax.plot(x, y2, label='余弦曲线')

# 添加标签
ax.set_xlabel('X轴')
ax.set_ylabel('Y轴')
ax.legend()

# 悬停事件处理函数
def on_hover(sel):
    ind = sel.target.index
    x_val = sel.target[0]
    y_val = sel.target[1]
    label = sel.artist.get_label()

    print(f"在{label}上的点 ({x_val:.2f}, {y_val:.2f})")

# 使用 mplcursors 注册悬停事件处理函数
mplcursors.cursor(hover=True).connect("add", on_hover)

# 显示图表
plt.show()
代码解析
我们首先使用 numpy 库创建了样本数据。
使用 Matplotlib 绘制了两条曲线(正弦和余弦)。
添加了标签和图例以增强可读性。
使用 mplcursors 库添加了一个悬停事件,用于打印有关悬停点的信息。
交互式探索
运行代码后,将会弹出一个窗口显示绘制的曲线。将鼠标悬停在曲线上的点上,你将看到有关该点(x,y)坐标以及所在曲线的信息。
这种交互功能对于详细探索数据点非常有用。
随意尝试不同的数据集并根据需要自定义代码。
愉快编码!
文章来源:https://blog.csdn.net/qq_43324506/article/details/135002565
本文来自互联网用户投稿,该文观点仅代表作者本人,不代表本站立场。本站仅提供信息存储空间服务,不拥有所有权,不承担相关法律责任。 如若内容造成侵权/违法违规/事实不符,请联系我的编程经验分享网邮箱:chenni525@qq.com进行投诉反馈,一经查实,立即删除!
本文来自互联网用户投稿,该文观点仅代表作者本人,不代表本站立场。本站仅提供信息存储空间服务,不拥有所有权,不承担相关法律责任。 如若内容造成侵权/违法违规/事实不符,请联系我的编程经验分享网邮箱:chenni525@qq.com进行投诉反馈,一经查实,立即删除!
最新文章
- Python教程
- 深入理解 MySQL 中的 HAVING 关键字和聚合函数
- Qt之QChar编码(1)
- MyBatis入门基础篇
- 用Python脚本实现FFmpeg批量转换
- 【深度解析C++之初始化列表】
- reset.css重置样式
- java面试题——多线程01
- Ubuntu20.04.2-mate上Lazarus安装与测试
- 【算法分析与设计】和为k的子数组
- 使用Python基于metricbeat和heartbeat采集数据进行告警
- [足式机器人]Part2 Dr. CAN学习笔记-Advanced控制理论 Ch04-16 Robust Controller非线性鲁棒控制器
- python定义代码块的符号,python中代码块所属关系
- 理想架构的非对称高回退Doherty功率放大器理论与仿真
- Jenkins的文档翻译