js遍历后端返回的集合将条件相同的放入同一个数组内
发布时间:2023年12月28日
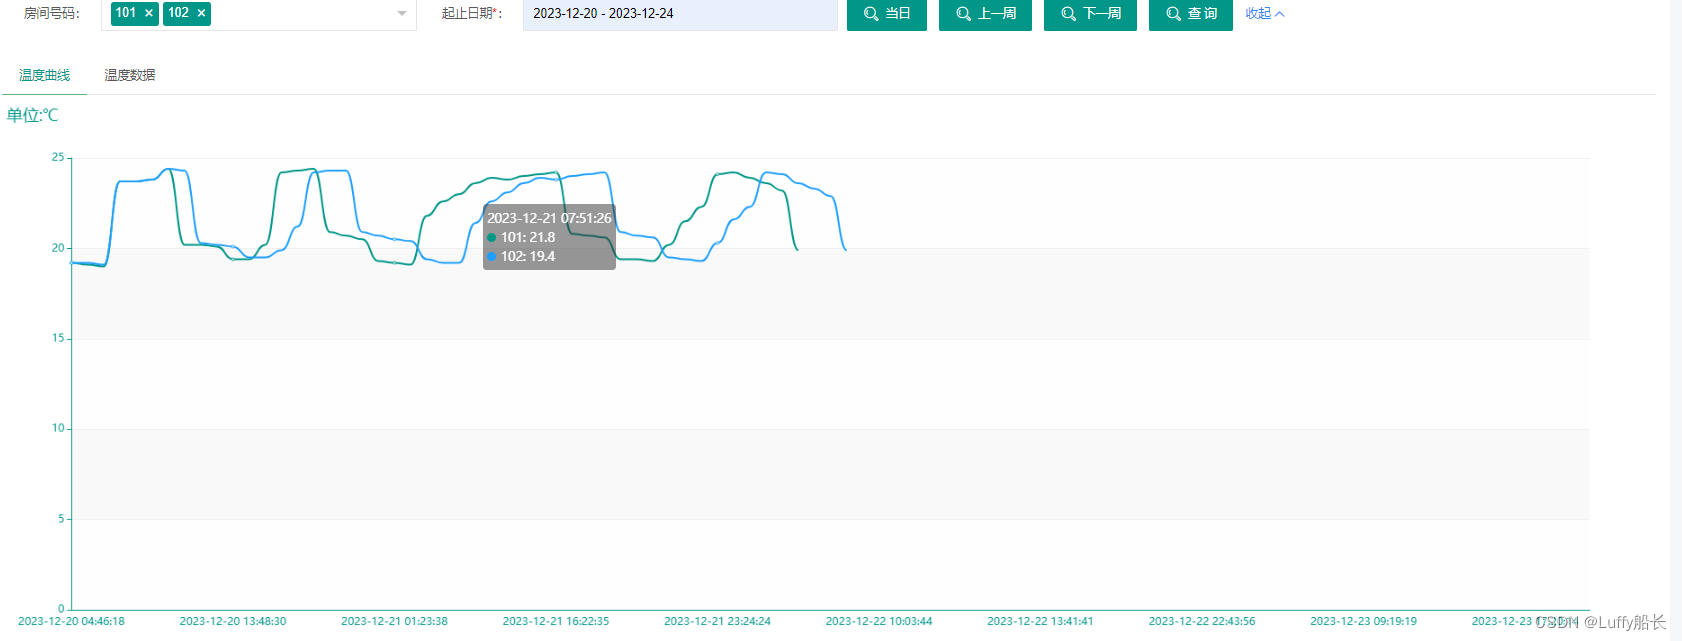
项目场景:
echarts折线图需要根据条件动态展示多条不同曲线
解决方案:
后端直接将使用sql将数据查询出来返回即可,因为我这里不是Java使用的C#不是很熟练后台不好写逻辑,所以在前端js完成的
代码如下:
?function createline(villagename, buildingname, unitname, roomname, startime, stoptime) {
? ? // console.log("roomname: "+roomname)
? ? ?//$("#demo").empty();
? ? ?var myChart = echarts.init(document.getElementById('demo'), myEchartsTheme);
? ? ?myChart.clear();
? ? ?var tempindoor = [],

? ? ? ? ?tempset = [],
? ? ? ? ?tempwaterin = [],
? ? ? ? ?tempwaterout = [];
? ? ?$.ajax({
? ? ? ? ?type: 'post',
? ? ? ? ?url: '../AJAXHandler.ashx',
? ? ? ? ?data: {
? ? ? ? ? ? ?"Method": "GetData",
? ? ? ? ? ? ?"limit": 99999,
? ? ? ? ? ? ?"page": 1,
? ? ? ? ? ? ?"VillageName": villagename,
? ? ? ? ? ? ?"BuildingName": buildingname,
? ? ? ? ? ? ?"UnitName": unitname,
? ? ? ? ? ? ?"RoomName": roomname,
? ? ? ? ? ? ?"startime": startime,
? ? ? ? ? ? ?"stoptime": stoptime
? ? ? ? ?},
? ? ? ? ?success: function (res) {
? ? ? ? ? ? ?var xData = [];
? ? ? ? ? ? ?//console.log("res: "+res);
? ? ? ? ? ? ?var json = $.parseJSON(res);
? ? ? ? ? ? ?json = json.data;
? ? ? ? ? ? ?for (var i = 0; i < json.length; i++) {
? ? ? ? ? ? ? ? ?tempindoor.push(json[i].TMP_INDOOR);
? ? ? ? ? ? ? ? ?//console.log("tempindoor: "+tempindoor);
? ? ? ? ? ? ? ? ?tempset.push(json[i].TMP_SET);
? ? ? ? ? ? ? ? ?tempwaterin.push(json[i].TEMP_WATER_IN);
? ? ? ? ? ? ? ? ?tempwaterout.push(json[i].TEMP_WATER_OUT);
? ? ? ? ? ? ? ? ?xData.push(new Date(json[i].RTime).format('yyyy-MM-dd hh:mm:ss'));
? ? ? ? ? ? ?}
/**这里定义新的数组将查到的数据通过遍历存到新数组内,然后根据判断是否有相同的数据,如果没有就走if内的语句存入数组内,如果有相同的就走else内的语句,之后将数据存到map里根据条件去展示符合的数据,然后将这个map存到echarts渲染的部分的数组内 就可以做到动态展示了**/
? ? ? ? ? ? ?const result = [];
? ? ? ? ? ? ?json.forEach((item) => {
? ? ? ? ? ? ? ? ?const index = result.findIndex((r) => r.room === item.room);
? ? ? ? ? ? ? ? ?if (index === -1) {
? ? ? ? ? ? ? ? ? ? ?result.push({ room: item.room, names: [item.TMP_INDOOR] });
? ? ? ? ? ? ? ? ?} else {
? ? ? ? ? ? ? ? ? ? ?result[index].names.push(item.TMP_INDOOR);
? ? ? ? ? ? ? ? ?}
? ? ? ? ? ? ?});
? ? ? ? ? ? ?//console.log(result);
? ? ? ? ? ? ?const legend = result.map(item => item.room); // 图例
? ? ? ? ? ? ?const arr = result.map(item => ({ // 数据
? ? ? ? ? ? ? ? ?name: item.room,
? ? ? ? ? ? ? ? ?type: "line",
? ? ? ? ? ? ? ? ?data: item.names
? ? ? ? ? ? ?}));
? ? ? ? ? ? ?//手机适配
? ? ? ? ? ? ?if (window.screen.width < 1000) {
? ? ? ? ? ? ? ? ?var legends = {
? ? ? ? ? ? ? ? ? ? ?x: '100px',
? ? ? ? ? ? ? ? ? ? ?//data: ['室内温度', ?'设定温度', '进水温度', '回水温度']
? ? ? ? ? ? ? ? ? ? ?data: ['室内温度'],
? ? ? ? ? ? ? ? ? ? ?textStyle: {
? ? ? ? ? ? ? ? ? ? ? ? ?color: '#009688'
? ? ? ? ? ? ? ? ? ? ?}
? ? ? ? ? ? ? ? ?};
? ? ? ? ? ? ?} else {
? ? ? ? ? ? ? ? ?var legends = {
? ? ? ? ? ? ? ? ? ? ?x: 'center',
? ? ? ? ? ? ? ? ? ? ?//data: ['室内温度', ?'设定温度', '进水温度', '回水温度']
? ? ? ? ? ? ? ? ? ? ?data: ['室内温度'],
? ? ? ? ? ? ? ? ? ? ?textStyle: {
? ? ? ? ? ? ? ? ? ? ? ? ?color: '#009688'
? ? ? ? ? ? ? ? ? ? ?}
? ? ? ? ? ? ? ? ?};
? ? ? ? ? ? ?}

? ? ? ? ? ? ?var option = createoption('单位:℃', xData, legends, arr);
? ? ? ? ? ? ?myChart.setOption(option, true);
? ? ? ? ? ? ?//EChars图手机适配
? ? ? ? ? ? ?window.onresize = myChart.resize;
? ? ? ? ?},
? ? ? ? ?error: function () {
? ? ? ? ? ? ?//alert("折线图报错!");
? ? ? ? ?}
? ? ?});
? ? ?tempindoor = [], tempset = [], tempwaterin = [], tempwaterout = [];
?}
文章来源:https://blog.csdn.net/m0_60741007/article/details/135260173
本文来自互联网用户投稿,该文观点仅代表作者本人,不代表本站立场。本站仅提供信息存储空间服务,不拥有所有权,不承担相关法律责任。 如若内容造成侵权/违法违规/事实不符,请联系我的编程经验分享网邮箱:chenni525@qq.com进行投诉反馈,一经查实,立即删除!
本文来自互联网用户投稿,该文观点仅代表作者本人,不代表本站立场。本站仅提供信息存储空间服务,不拥有所有权,不承担相关法律责任。 如若内容造成侵权/违法违规/事实不符,请联系我的编程经验分享网邮箱:chenni525@qq.com进行投诉反馈,一经查实,立即删除!
最新文章
- Python教程
- 深入理解 MySQL 中的 HAVING 关键字和聚合函数
- Qt之QChar编码(1)
- MyBatis入门基础篇
- 用Python脚本实现FFmpeg批量转换
- 【USTC】verilog 习题练习 31-35
- HTML基础
- 零知识证明友好的波塞冬哈希(ZK-friendly Hashing: Poseidon)
- 【小技巧】得力多功能计算器,小数变成10的负幂,应该怎么设置正常显示小数
- js 七种继承方法
- 计算智能 | 粒子群算法
- 在做题中学习(35):判断字符是否唯一
- 运用 element ui组件 表格 分页器
- 自动派单系统哪家好?实现自动派单对于管理有什么帮助?
- 面试官:线程池的7种创建方式,你都清楚吗?