彻底解决可视化:中文字体显示「豆腐块」问题!
发布时间:2023年12月30日
问题复现
# 导入必要的包
library(ggplot2)

# 设置主题样式
theme_set(theme_minimal(base_size = 15))

# 创建一个简单的折线图
ggplot(data = data.frame(x = c(1, 2, 3), y = c(1, 2, 3)), aes(x = x, y = y)) +
  geom_line(color = "blue") +
  labs(title = "欢迎关注公众号:pythonic生物人", color = "red") +
  theme(plot.title = element_text(hjust = 0.5, color = "red"),
        axis.text = element_text(color = "black"))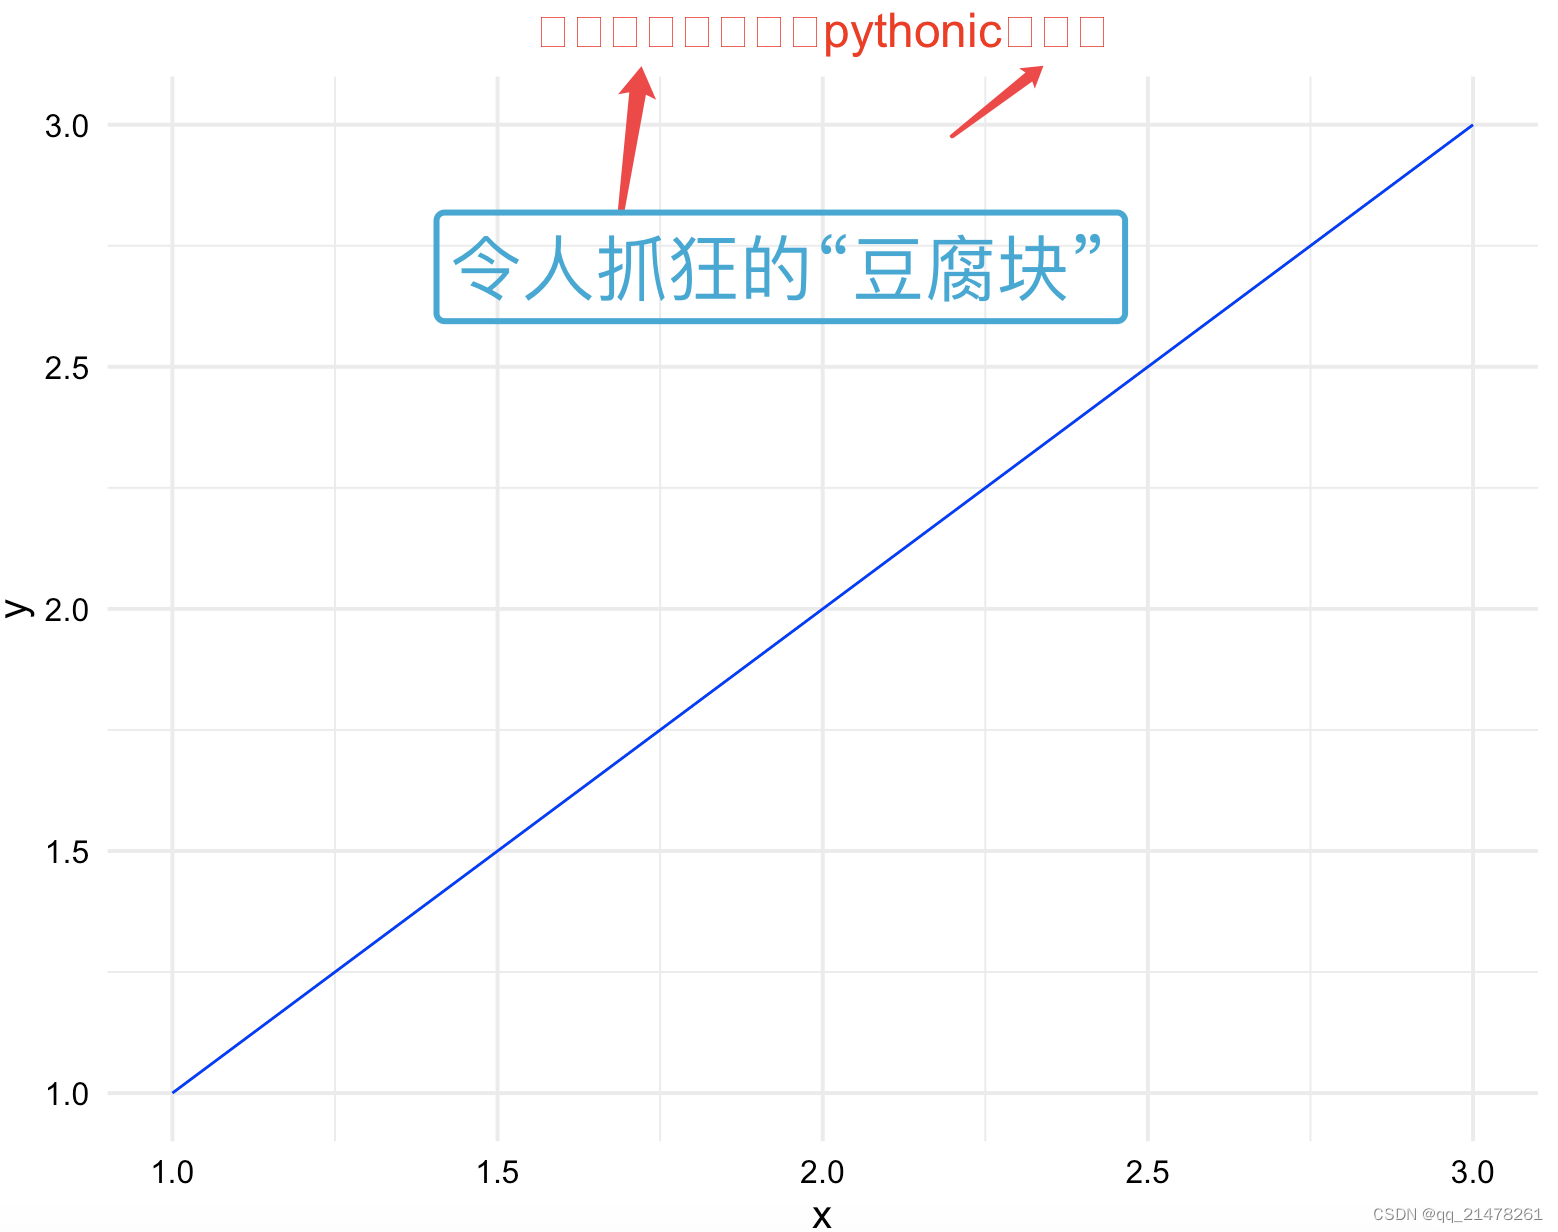
使用R绘图时,当涉及到中文字体时,常常出现上图中的“豆腐块”,下文介绍一种超级简单解决方法。
问题解决?
# 导入必要的包
library(ggplot2)
library(showtext)
showtext_auto()
# 设置主题样式
theme_set(theme_minimal(base_size = 15))
# 创建一个简单的折线图
ggplot(data = data.frame(x = c(1, 2, 3), y = c(1, 2, 3)), aes(x = x, y = y)) +
geom_line(color = "blue") +
labs(title = "欢迎关注公众号:pythonic生物人", color = "red") +
theme(plot.title = element_text(hjust = 0.5, color = "red"),
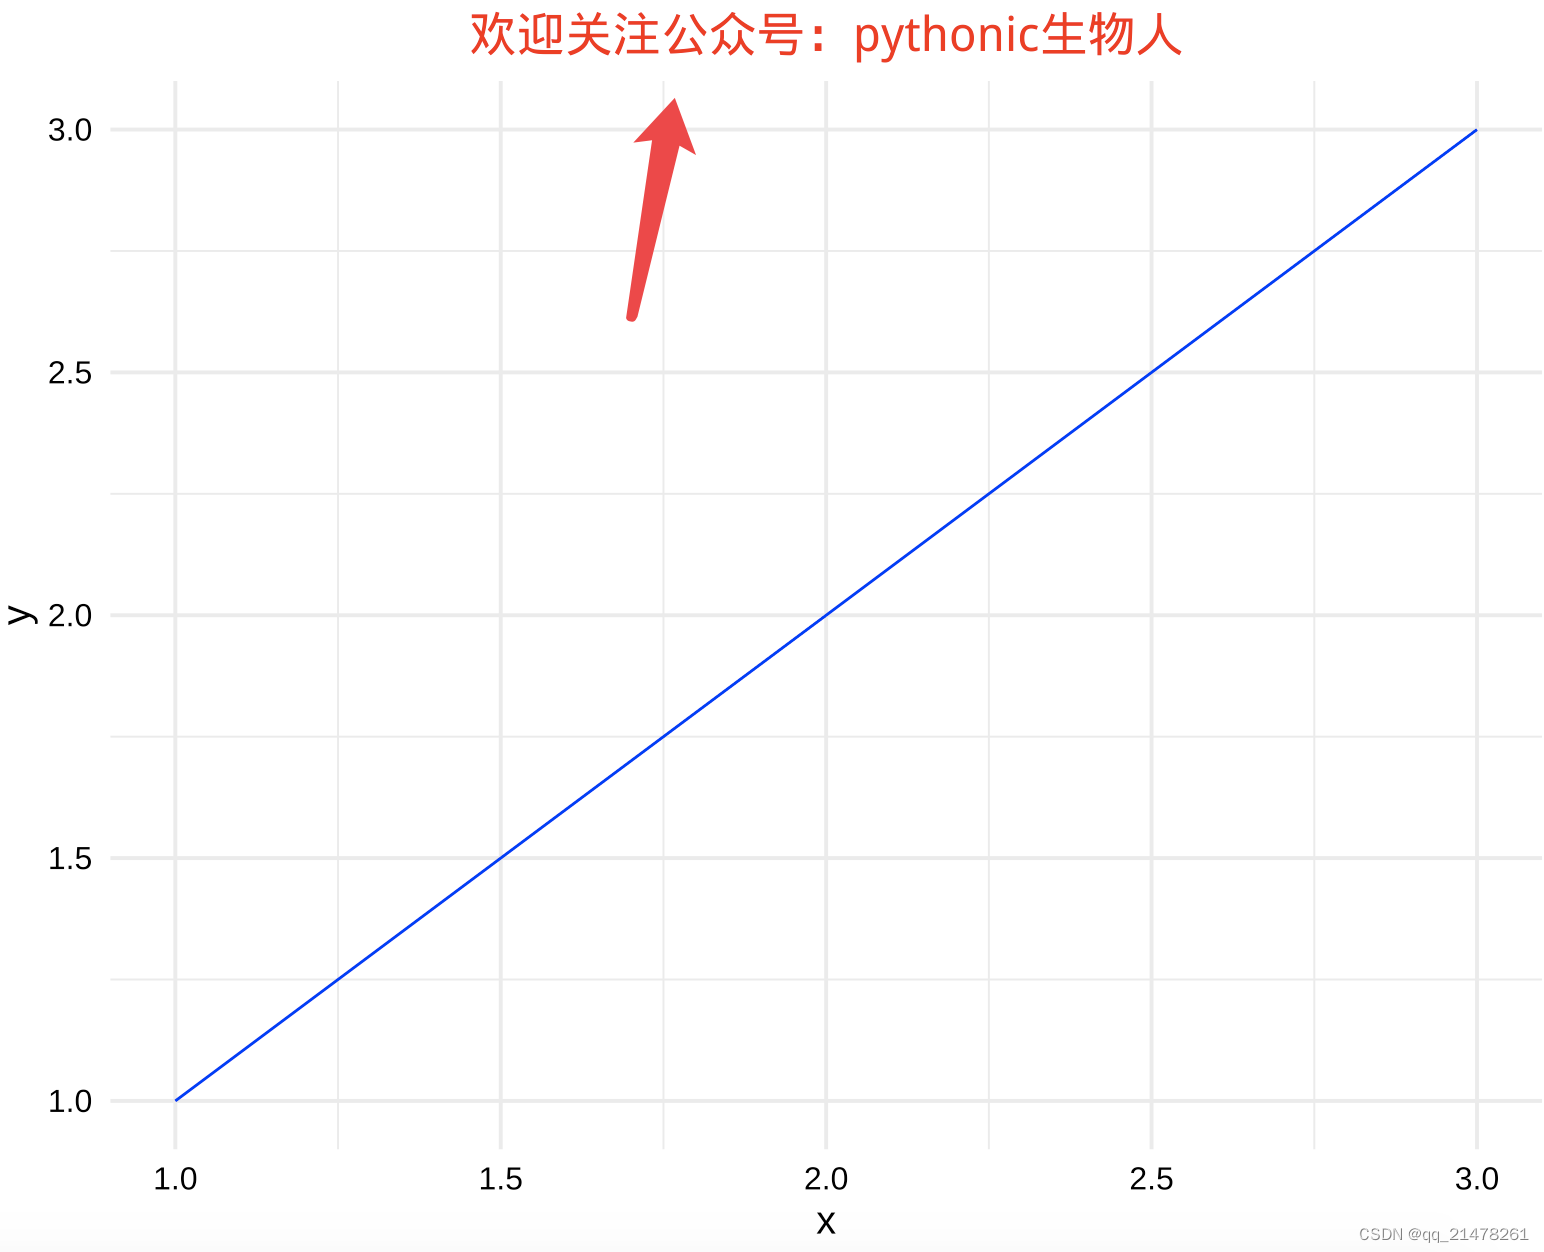
axis.text = element_text(color = "black"))主要借助showtext包,两行代码library(showtext) showtext_auto()解决问题,
关于showtext不过多介绍,
showtext?makes it easy to use various types of fonts (TrueType, OpenType, Type 1, web fonts, etc.) in R plots. The motivation to develop this package is that using non-standard fonts in R plots (especially for PDF device) is not straightforward, for example, when creating PDF with Chinese characters. This is because most of the standard fonts used by?
pdf()?do not contain Chinese character glyphs, and users could hardly use system fonts in R.GitHub - yixuan/showtext: Using Fonts More Easily in R Graphs
更多干货👇👇👇
文章来源:https://blog.csdn.net/qq_21478261/article/details/133441436
本文来自互联网用户投稿,该文观点仅代表作者本人,不代表本站立场。本站仅提供信息存储空间服务,不拥有所有权,不承担相关法律责任。 如若内容造成侵权/违法违规/事实不符,请联系我的编程经验分享网邮箱:chenni525@qq.com进行投诉反馈,一经查实,立即删除!
本文来自互联网用户投稿,该文观点仅代表作者本人,不代表本站立场。本站仅提供信息存储空间服务,不拥有所有权,不承担相关法律责任。 如若内容造成侵权/违法违规/事实不符,请联系我的编程经验分享网邮箱:chenni525@qq.com进行投诉反馈,一经查实,立即删除!
最新文章
- Python教程
- 深入理解 MySQL 中的 HAVING 关键字和聚合函数
- Qt之QChar编码(1)
- MyBatis入门基础篇
- 用Python脚本实现FFmpeg批量转换
- VIT用于图像分类 学习笔记(附代码)
- Python-os.path 学习
- 【Storm实战】1.2 图解Storm的架构及其组件
- 【知识分享】Java实现“羊了个羊”的思路和代码
- C语言学习第二十四天(预处理)
- 数据结构与算法:衡量算法好坏的指标——复杂度
- 计算机博弈求解算法
- mysql优化器对sql语句的简化(条件简化、外连接消除、子查询优化)
- 奇点云数据安全产品DataBlack更新,提供全域安全合规能力
- 技术变革下职业危机