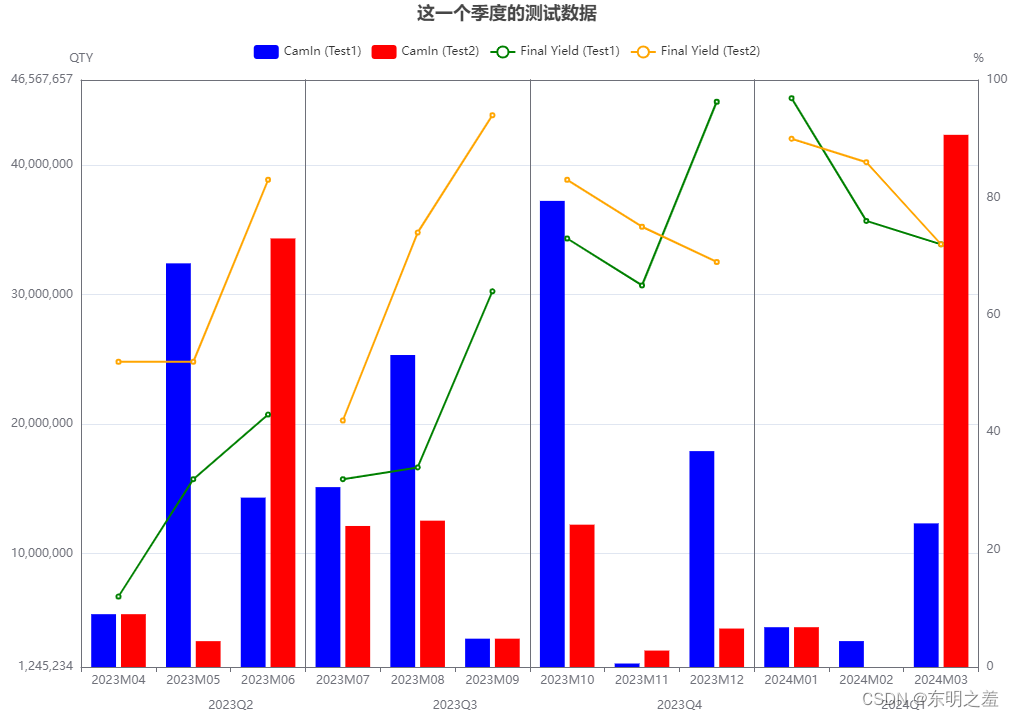
ECharts 多季度连续显示到一个图中。
发布时间:2024年01月15日
效果图
二.相关option
以下option可以复制到 echarts的编辑器 进行查看修改
const site = 'test1';
const site2 = 'test2';

const qtrlyOption = function (data: any, titleText: string): any {
  //获取最大值 。最大最小值的目的是:使左右里边的所有bar使用同一个指标
  let yAxisMax = 0;
  let yAxisMin = 0;


  //根据数据整理并获取最大和最小值
  let dataValue = [] as any;
  (data?.series?.[site]?.[0]?.data || []).forEach((item: any[]) => {
    dataValue.push(...item);
  });
  (data?.series?.[site2]?.[0]?.data || []).forEach((item: any[]) => {
    dataValue.push(...item);
  });
  dataValue = dataValue.map((li: number | null | undefined) => li || 0);
  yAxisMax = Math.max(...dataValue);
  const decimalPlaces =
    (yAxisMax + '').indexOf('.') > 0
      ? (yAxisMax + '').replace(/^.*[.]/g, '').length
      : 0;
  yAxisMax = yAxisMax * 1.1; //根据最大值进行10%的变大(显示出来的柱状不会顶到最上面)
  yAxisMax =
    decimalPlaces == 0
      ? parseInt(yAxisMax + '')
      : +yAxisMax.toFixed(decimalPlaces);
  yAxisMin = Math.min(...dataValue);  //得出和最大值一致的小数位


  //当前显示四个季度。根据显示季度个数,来计算subtitle,grid,对应的布局
  const qtrlyCount = 4 as number;

  //左侧预留位置尽可能的显示完整左侧坐标数值
  const leftPercent = 8 as number;
  //右侧预留位置尽可能的显示完整右侧坐标数值
  const rightPercent = 3.5 as number;

  //储存左右两侧开始的位置
  const left = new Array(qtrlyCount).fill('') as any[];
  const right = new Array(qtrlyCount).fill('') as any[];

  /**
   * 储存最下方季度[2023Q2,2023Q3,2023Q4,2024Q1]的显示文字位置
   */
  const title = [] as any[];

  /**
   * 布局右qtrlyCount=4 块图形区域组成,因此每个距离画布左右侧的位置需要计算出来
   */
  const grid = [] as any[];

  /**
   * x坐标轴。坐标轴为qtrlyCount*2个,前4个是下方的坐标轴。后4个是为了显示头上的坐标线
   */
  const xAxis = [] as any[];

  /**
   * y坐标轴。坐标轴为qtrlyCount*2个,前4个是左侧的坐标轴,为了显示bar。后4个是右侧坐标轴,为了显示line的百分值
   */
  const yAxis = [] as any[];

  /**
   * 组装数据 ,数据需要进行指定xAxisIndex下标, yAxisIndex下标。而xAxisIndex,yAxisIndex的下标又对于指定的gridIndex下标,可以对于到指定的图区域
   */
  const series = [] as any[];

  /**
   * 计算位置
   */
  for (let i = 0; i < qtrlyCount; i++) {
    const _leftPoint =
      ((100 - leftPercent - rightPercent) / qtrlyCount) * i + leftPercent;
    left[i] = _leftPoint;

    const _rightPoint =
      ((100 - leftPercent - rightPercent) / qtrlyCount) * i + rightPercent;
    right[qtrlyCount - 1 - i] = _rightPoint;
  }


  for (let i = 0; i < qtrlyCount; i++) {
    /**
     * title
     */
    title[i] = {
      left: left[i] + left[1] * 0.4 + '%',
      subtext: data.quarters[i],
      bottom: 0
    };
    /**
     * grid
     */
    grid[i] = {
      left:  left[i] + '%',
      right: right[i] + '%',
      bottom: 50,
      top: 80,
      gridIndex: i
    };

    xAxis[i] = {
      gridIndex: i,
      type: 'category',
      data: data.xAxis[i]
    };
    xAxis[i + qtrlyCount] = {
      gridIndex: i,
      type: 'category',
      data: data.xAxis[i],
      axisTick: {
        show: false
      },
      axisLine: {
        onZero: false
      },
      axisLabel: { show: false }
    };
    //用来实现双坐标轴,当前bar用最左坐标轴,line用最右侧坐标轴
    yAxis[i] = {
      gridIndex: i,
      type: 'value',
      dataType: 'bar', // 标记一下类型,表示后面数据如果是bar则需要对应到对应的yAxisIndex。实际配置中无此参数。
      axisLabel: { show: i == 0 }, //第一个坐标轴显示数字,后面的不显示
      axisLine: { show: true },
      splitLine: { show: true },
      max: () => yAxisMax,
      min: () => yAxisMin
    };

    //用来实现双坐标轴,当前bar用最左坐标轴,line用最右侧坐标轴
    yAxis[i + qtrlyCount] = {
      gridIndex: i,
      type: 'value',
      dataType: 'line', // 标记一下类型,表示后面数据如果是line则需要对应到对应的yAxisIndex。实际配置中无此参数。
      axisLabel: { show: i == qtrlyCount - 1 }, //最后一个坐标轴显示数字,后面的不显示
      axisLine: { show: true },
      splitLine: { show: false },
      max: () => {
        return 100;
      }
    };

    //为最左侧和最右侧坐标显示单位或类型
    if (i == 0) {
      yAxis[i] = {
        ...yAxis[i],
        name: 'QTY' //添加单位
      };
    }
    if (i == qtrlyCount - 1) {
      yAxis[i + qtrlyCount] = {
        ...yAxis[i + qtrlyCount],
        name: '%'
      };
    }
    series.push({
      name: data.series?.[site][0].name,
      data: data.series?.[site][0].data[i],
      type: 'bar',
      xAxisIndex: i,
      yAxisIndex: i,
      color: 'blue'
    });
    series.push({
      name: data.series?.[site2][0].name,
      data: data.series?.[site2][0].data[i],
      type: 'bar',
      xAxisIndex: i,
      yAxisIndex: i,
      color: 'red'
    });

    series.push({
      name: data.series?.[site][1].name,
      data: data.series?.[site][1].data[i],
      type: 'line',
      xAxisIndex: i,
      yAxisIndex: i + qtrlyCount,
      color: 'green'
    });

    series.push({
      name: data.series?.[site2][1].name,
      data: data.series?.[site2][1].data[i],
      type: 'line',
      xAxisIndex: i,
      yAxisIndex: i + qtrlyCount,
      color: 'orange'
    });
  }

  title.push({ left: 'center', top: 0, text: titleText });

  return {
    toolbox: {
      show: true,
      feature: {
        dataZoom: {
          yAxisIndex: 'none',
          title: {
            zoom: '区域缩放',
            back: '区域缩放还原'
          }
        },
        saveAsImage: {
          title: '保存为图片'
        }
      }
    },
    legend: {
      show: true,
      top: 40,
      data: data.legend
    },
    title,
    tooltip: { trigger: 'axis' },
    xAxis,
    yAxis,
    grid,
    series
  };
};
const data = {
  quarters: ['2023Q2', '2023Q3', '2023Q4', '2024Q1'],
  xAxis: [
    ['2023M04', '2023M05', '2023M06'],
    ['2023M07', '2023M08', '2023M09'],
    ['2023M10', '2023M11', '2023M12'],
    ['2024M01', '2024M02', '2024M03']
  ],
  legend: [
    'CamIn (Test1)',
    'CamIn (Test2)',
    'Final Yield (Test1)',
    'Final Yield (Test2)'
  ],
  series: {
    test1: [
      {
        factory: 'Test1hou',
        name: 'CamIn (Test1)',
        type: 'bar',
        data: [
          [5323451, 32411232, 14323414],
          [15133835, 25333835, 3432342],
          [37233835, 1513835, 17913835],
          [4317244, 3245234, 12334234]
        ]
      },
      {
        factory: 'Test1hou',
        name: 'Final Yield (Test1)',
        type: 'line',
        data: [
          [12, 32,43],
          [32, 34, 64],
          [73, 65, 96.30],
          [96.90,76, 72]
        ]
      }
    ],
    test2: [
      {
        factory: 'Penang',
        name: 'CamIn (Test2)',
        type: 'bar',
        data: [
          [5323321, 3241132, 34334314],
          [12133335, 12543835, 3432342],
          [12234435, 2513835, 4213835],
          [4317244, 1245234, 42334234]
        ]
      },
      {
        factory: 'Penang',
        name: 'Final Yield (Test2)',
        type: 'line',
        data: [
          [52, 52,83],
          [42, 74, 94],
          [83, 75, 69],
          [90,86, 72]
        ]
      }
    ]
  }
} as any;

option = qtrlyOption(data, '这一个季度的测试数据');
文章来源:https://blog.csdn.net/qq_28254093/article/details/135597934
本文来自互联网用户投稿,该文观点仅代表作者本人,不代表本站立场。本站仅提供信息存储空间服务,不拥有所有权,不承担相关法律责任。 如若内容造成侵权/违法违规/事实不符,请联系我的编程经验分享网邮箱:chenni525@qq.com进行投诉反馈,一经查实,立即删除!
本文来自互联网用户投稿,该文观点仅代表作者本人,不代表本站立场。本站仅提供信息存储空间服务,不拥有所有权,不承担相关法律责任。 如若内容造成侵权/违法违规/事实不符,请联系我的编程经验分享网邮箱:chenni525@qq.com进行投诉反馈,一经查实,立即删除!
最新文章
- Python教程
- 深入理解 MySQL 中的 HAVING 关键字和聚合函数
- Qt之QChar编码(1)
- MyBatis入门基础篇
- 用Python脚本实现FFmpeg批量转换
- 「微服务」微服务架构中的数据一致性
- 汉印HPRT MT818移动便携式热转印A4打印机使用说明
- 【Python程序开发系列】一文带你了解Python抽象语法树(案例分析)
- WeNet语音识别分词制作词云图
- SSM实现的校园门户平台网站系统----计算机毕业设计
- SNP Glue新Saas技术在云数据集成中如何提升客户价值
- 数据结构奇妙旅程之栈和队列
- Nginx优化(重点)与防盗链(新版)
- Pytorch:torch.nn.Module.apply用法详解
- GSCoolink GSV1201E Type C/DP1.2转HDM1.4