【人工智能】找出最适合线性模型的直线-成本函数介绍及python实现
线性模型-成本函数介绍及python实现
一、成本函数介绍及python实现
1、导入数据
# 导入数据
import pandas as pd

url = "https://raw.githubusercontent.com/Resgression/Salary_Data.csv"
data = pd.read_csv(url)
data

# y = w*x + b
x = data["YearsExperience"]
y = data["Salary"]
x
0      0.3
1      0.6
2      0.8
3      1.1
4      1.3
5      1.5
6      2.0
7      2.2
8      2.9
9      3.0
10     3.2
11     3.2
12     3.7
13     3.9
14     4.0
15     4.0
16     4.1
17     4.5
18     4.9
19     5.1
20     5.3
21     5.9
22     6.0
23     6.8
24     7.1
25     7.9
26     8.2
27     8.7
28     9.0
29     9.5
30     9.6
31    10.3
32    10.5
Name: YearsExperience, dtype: float64
2、列出成本函数公式
# 预测值的线性公式:y_pred = w*x + b
# cost function 成本函数公式:cost=(真实值-预测值)的平方,找出最适合的直线
w = 10
b = 0
y_pred = w*x + b
cost = (y - y_pred)**2
3、定义cost function函数
# 定义cost function函数
def compute(x,y,w,b):
  y_pred = w*x + b
  cost = (y - y_pred)**2
  cost = cost.sum() / len(x)
  return cost
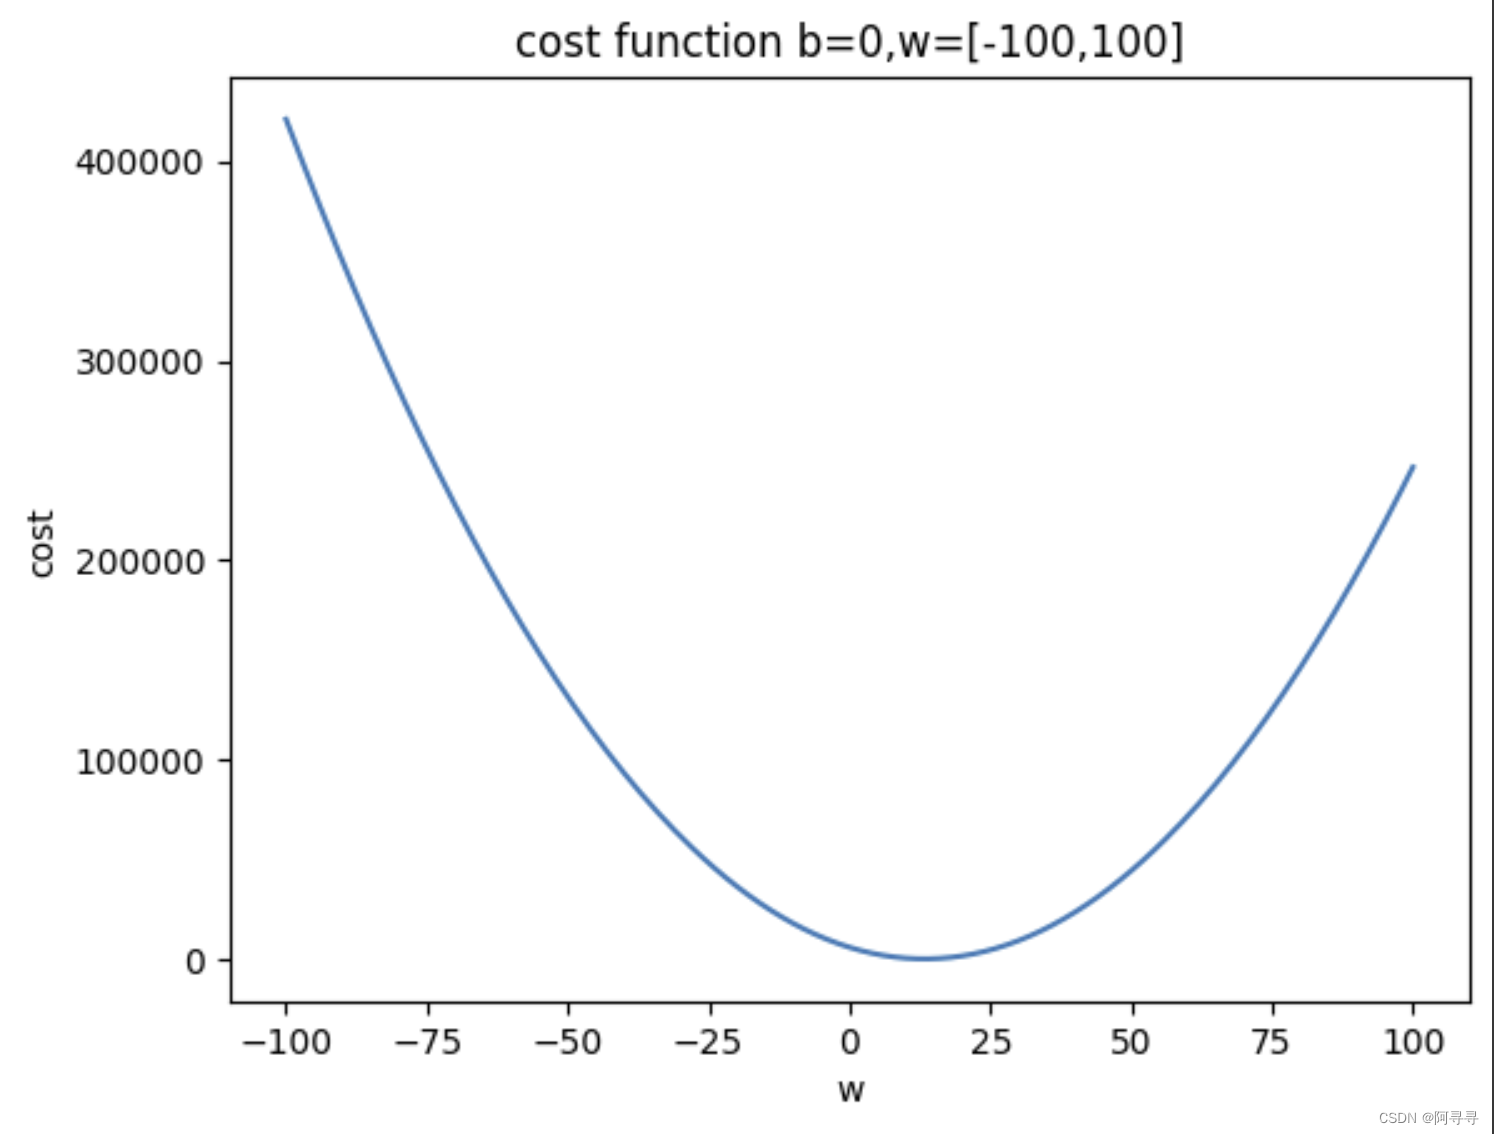
4、示例:当b为0,w为[-100,100]之间,查看cost的值
# 示例:当b为0,w为[-100,100]之间,查看cost的值
costs = []
for w in range(-100,101):
  cost = compute(x,y,w,0)
  costs.append(cost)

costs
153122.113030303,
 148678.02909090905,
 144299.49606060603,
 139986.51393939395,
 135739.0827272727,
 131557.20242424242,
 127440.87303030302,
 123390.09454545454,
 119404.86696969694,
 115485.19030303031,
 111631.06454545453,
 107842.4896969697,
 104119.46575757574,
 100461.99272727272,
 96870.0706060606,
 93343.69939393939,
 89882.87909090909,
 86487.60969696968,
 83157.8912121212,
 79893.72363636363,
 76695.10696969698,
 73562.04121212121,
 70494.52636363637,
 67492.56242424241,
 64556.149393939384,
 61685.28727272727,
 58879.97606060606,
 56140.21575757576,
 53466.00636363636,
 50857.34787878788,
 48314.2403030303,
 45836.68363636363,
 43424.67787878788,
 41078.22303030303,
 38797.31909090909,
 36581.96606060606,
 34432.16393939394,
 32347.91272727273,
 30329.21242424242,
 28376.063030303034,
 26488.464545454543,
 24666.41696969697,
 22909.920303030303,
 21218.97454545455,
 19593.5796969697,
 18033.73575757576,
 16539.44272727273,
 15110.700606060605,
 13747.509393939394,
 12449.869090909091,
 11217.779696969697,
 10051.241212121213,
 8950.253636363635,
 7914.81696969697,
 6944.931212121212,
 6040.596363636363,
 5201.812424242424,
 4428.579393939393,
 3720.8972727272726,
 3078.7660606060604,
 2502.1857575757576,
 1991.1563636363637,
 1545.6778787878789,
 1165.750303030303,
 851.3736363636364,
 602.547878787879,
 419.27303030303034,
 301.54909090909086,
 249.37606060606066,
 262.75393939393945,
 341.6827272727273,
 486.1624242424242,
 696.1930303030302,
 971.7745454545454,
 1312.9069696969698,
 1719.590303030303,
 2191.8245454545454,
 2729.609696969697,
 3332.9457575757574,
 4001.8327272727265,
 4736.270606060605,
 5536.259393939394,
 6401.7990909090895,
 7332.889696969696,
 8329.531212121212,
 9391.723636363637,
 10519.466969696969,
 11712.761212121211,
 12971.606363636363,
 14296.002424242422,
 15685.949393939394,
 17141.44727272727,
 18662.49606060606,
 20249.095757575757,
 21901.24636363636,
 23618.94787878788,
 25402.200303030302,
 27251.003636363635,
 29165.357878787876,
 31145.26303030303,
 33190.71909090909,
 35301.72606060606,
 37478.283939393936,
 39720.39272727272,
 42028.05242424242,
 44401.26303030303,
 46840.024545454544,
 49344.33696969697,
 51914.20030303031,
 54549.61454545455,
 57250.5796969697,
 60017.09575757576,
 62849.16272727272,
 65746.7806060606,
 68709.9493939394,
 71738.6690909091,
 74832.9396969697,
 77992.76121212122,
 81218.13363636362,
 84509.05696969696,
 87865.53121212122,
 91287.55636363637,
 94775.13242424243,
 98328.25939393938,
 101946.93727272727,
 105631.16606060608,
 109380.94575757576,
 113196.27636363637,
 117077.15787878788,
 121023.5903030303,
 125035.57363636365,
 129113.1078787879,
 133256.19303030302,
 137464.82909090907,
 141739.01606060608,
 146078.75393939397,
 150484.04272727275,
 154954.88242424242,
 159491.273030303,
 164093.21454545457,
 168760.70696969697,
 173493.7503030303,
 178292.34454545454,
 183156.48969696971,
 188086.18575757576,
 193081.4327272727,
 198142.23060606062,
 203268.57939393944,
 208460.4790909091,
 213717.9296969697,
 219040.9312121212,
 224429.48363636364,
 229883.586969697,
 235403.24121212118,
 240988.44636363635,
 246639.20242424245]
5、画出cost function直线图
# 画出cost function直线图
import matplotlib.pyplot as plt

# plt.scatter(range(-100,101),costs)
# plt.show()
plt.plot(range(-100,101),costs)
plt.title("cost function b=0,w=[-100,100]")
plt.xlabel("w")
plt.ylabel("cost")
plt.show()

6、计算出 w,b均在[-100,100]之间的3维cost function值
# 计算出 w,b均在[-100,100]之间的3维cost function值
import numpy as np

ws = np.arange(-100,101)
bs = np.arange(-100,101)

costs = np.zeros((201,201))

i = 0
for w in ws :
  j = 0
  for b in bs :
    cost = compute(x,y,w,b)
    costs[i,j]=cost
    j = j+1
  i = i+1
costs
array([[543097.74787879, 541777.28121212, 540458.81454545, ...,
        320651.34787879, 319726.88121212, 318804.41454545],
       [534727.50939394, 533416.80636364, 532108.10333333, ...,
        314214.30939394, 313299.60636364, 312386.90333333],
       [526422.82181818, 525121.88242424, 523822.9430303 , ...,
        307842.82181818, 306937.88242424, 306034.9430303 ],
       ...,
       [164229.90787879, 164842.64121212, 165457.37454545, ...,
        324557.10787879, 325565.84121212, 326576.57454545],
       [168838.74939394, 169461.24636364, 170085.74333333, ...,
        331099.14939394, 332117.64636364, 333138.14333333],
       [173513.14181818, 174145.40242424, 174779.6630303 , ...,
        337706.74181818, 338735.00242424, 339765.2630303 ]])
7、导入中文包
# 导入中文包
!pip install wget
import wget
wget.download("https://github.com/GrandmaCan/ML/raw/main/Resgression/ChineseFont.ttf")
8、画出 w,b均在[-100,100]之间的3维cost function图
# 画出 w,b均在[-100,100]之间的3维cost function图

import matplotlib as mlp

# 引入上面下载得到中文包
from matplotlib.font_manager import fontManager

fontManager.addfont("ChineseFont.ttf")
mlp.rc('font',family="ChineseFont")

plt.figure(figsize=(7,7)) # 设定3维图大小

ax = plt.axes(projection="3d") # 3D图
ax.view_init(45,-120) # 图像旋转
ax.xaxis.set_pane_color((1,1,1)) # X轴color
ax.yaxis.set_pane_color((1,1,1)) # Y轴color
ax.zaxis.set_pane_color((1,1,1)) # Z轴color

b_grid,w_grid = np.meshgrid(bs,ws) # 二维网格

# 3D图展示
ax.plot_surface(w_grid,b_grid,costs,cmap="Spectral_r",alpha=0.7) #绘制曲面图
ax.plot_wireframe(w_grid,b_grid,costs,color="white",alpha=0.1)

ax.set_title("w、b 对应的 cost")
ax.set_xlabel("w")
ax.set_ylabel("b")
ax.set_zlabel("cost")

# 寻找cost最小值
w_index,b_index = np.where(costs==np.min(costs))
ax.scatter(ws[w_index],bs[b_index],costs[w_index,b_index],color="black",s=40)

plt.show()

print(f"当w={ws[w_index]},b={bs[b_index]},有最小cost值{costs[w_index,b_index]}")

二、matplotlib.pyplot 简介
1、简介
matplotlib.pyplot 是 Python 编程语言中 matplotlib 库的一个模块,它提供了一个类似于 MATLAB 的绘图框架。matplotlib 是 Python 中最受欢迎和广泛使用的绘图库之一,它能够生成高质量的二维图形。使用 pyplot 接口,用户可以轻松地制作线图、散点图、柱状图、饼图、直方图、误差图、箱型图等多种图表。
主要特点
-
简单易用:
pyplot提供了一组类似于 MATLAB 的命令式函数,使得用户能够方便地创建图表和修改图表元素。
-
高度可定制:
- 几乎图表的所有部分都是可定制的,包括图表大小、颜色、线型、字体、坐标轴、标签、图例等。
-
多种图表类型:
- 支持多种图表类型,如线图、散点图、柱状图、直方图、饼图、箱型图等。
-
交互式环境:
- 在支持的环境中(如 Jupyter notebook),
pyplot可以生成交互式图表,用户可以放大、缩小或平移图表。
- 在支持的环境中(如 Jupyter notebook),
-
集成其他库:
matplotlib.pyplot与 Pandas、NumPy 等数据处理库良好集成,可以直接处理这些库的数据结构。
-
保存和导出:
- 支持多种文件格式保存图表,如 PNG、PDF、SVG、EPS 等。
使用示例
下面是一个简单的使用 matplotlib.pyplot 绘制线图的示例:
import matplotlib.pyplot as plt

# 准备数据
x = [1, 2, 3, 4, 5]
y = [1, 4, 9, 16, 25]

# 创建图表
plt.plot(x, y)

# 添加标题和标签
plt.title("Simple Plot")
plt.xlabel("x")
plt.ylabel("y")

# 显示图表
plt.show()
这段代码会创建一个简单的线图,显示 x 和 y 数值的关系。
总结
matplotlib.pyplot 是 Python 中用于数据可视化的强大工具,适用于科学计算、数据分析、机器学习等多个领域。它的灵活性和易用性使其成为数据可视化的首选工具之一。通过 pyplot,即使是初学者也能快速地创建漂亮且有表现力的图表。
2、画3D图形常用语法及举例
在 matplotlib 中,您可以使用 mpl_toolkits.mplot3d 模块来创建三维图形。matplotlib.pyplot 与此模块结合,使得绘制三维图形变得简单。以下是绘制三维图形的一些常用语法和技巧:
导入必要的模块
首先,您需要导入 matplotlib.pyplot 和 mplot3d 模块:
import matplotlib.pyplot as plt
from mpl_toolkits.mplot3d import Axes3D
创建3D坐标轴
在绘图之前,您需要创建一个带有3D坐标轴的图形:
fig = plt.figure()
ax = fig.add_subplot(111, projection='3d')
add_subplot(111, projection='3d') 创建了一个3D坐标轴的实例。
绘制3D图形
-
3D线图(Line plot):
使用
plot方法绘制三维线图。x = [1, 2, 3, 4, 5] y = [5, 6, 2, 3, 13] z = [2, 3, 3, 3, 5] ax.plot(x, y, z) -
3D散点图(Scatter plot):
使用
scatter方法绘制三维散点图。ax.scatter(x, y, z) -
3D曲面图(Surface plot):
首先需要生成网格数据,然后使用
plot_surface方法。import numpy as np X, Y = np.meshgrid(x, y) Z = np.sin(np.sqrt(X**2 + Y**2)) ax.plot_surface(X, Y, Z, cmap='viridis')这里
cmap='viridis'是设置曲面的颜色映射。
设置坐标轴标签
为了更好地理解图形,您可以设置坐标轴的标签:
ax.set_xlabel('X Label')
ax.set_ylabel('Y Label')
ax.set_zlabel('Z Label')
显示图形
最后,使用 plt.show() 方法来显示图形:
plt.show()
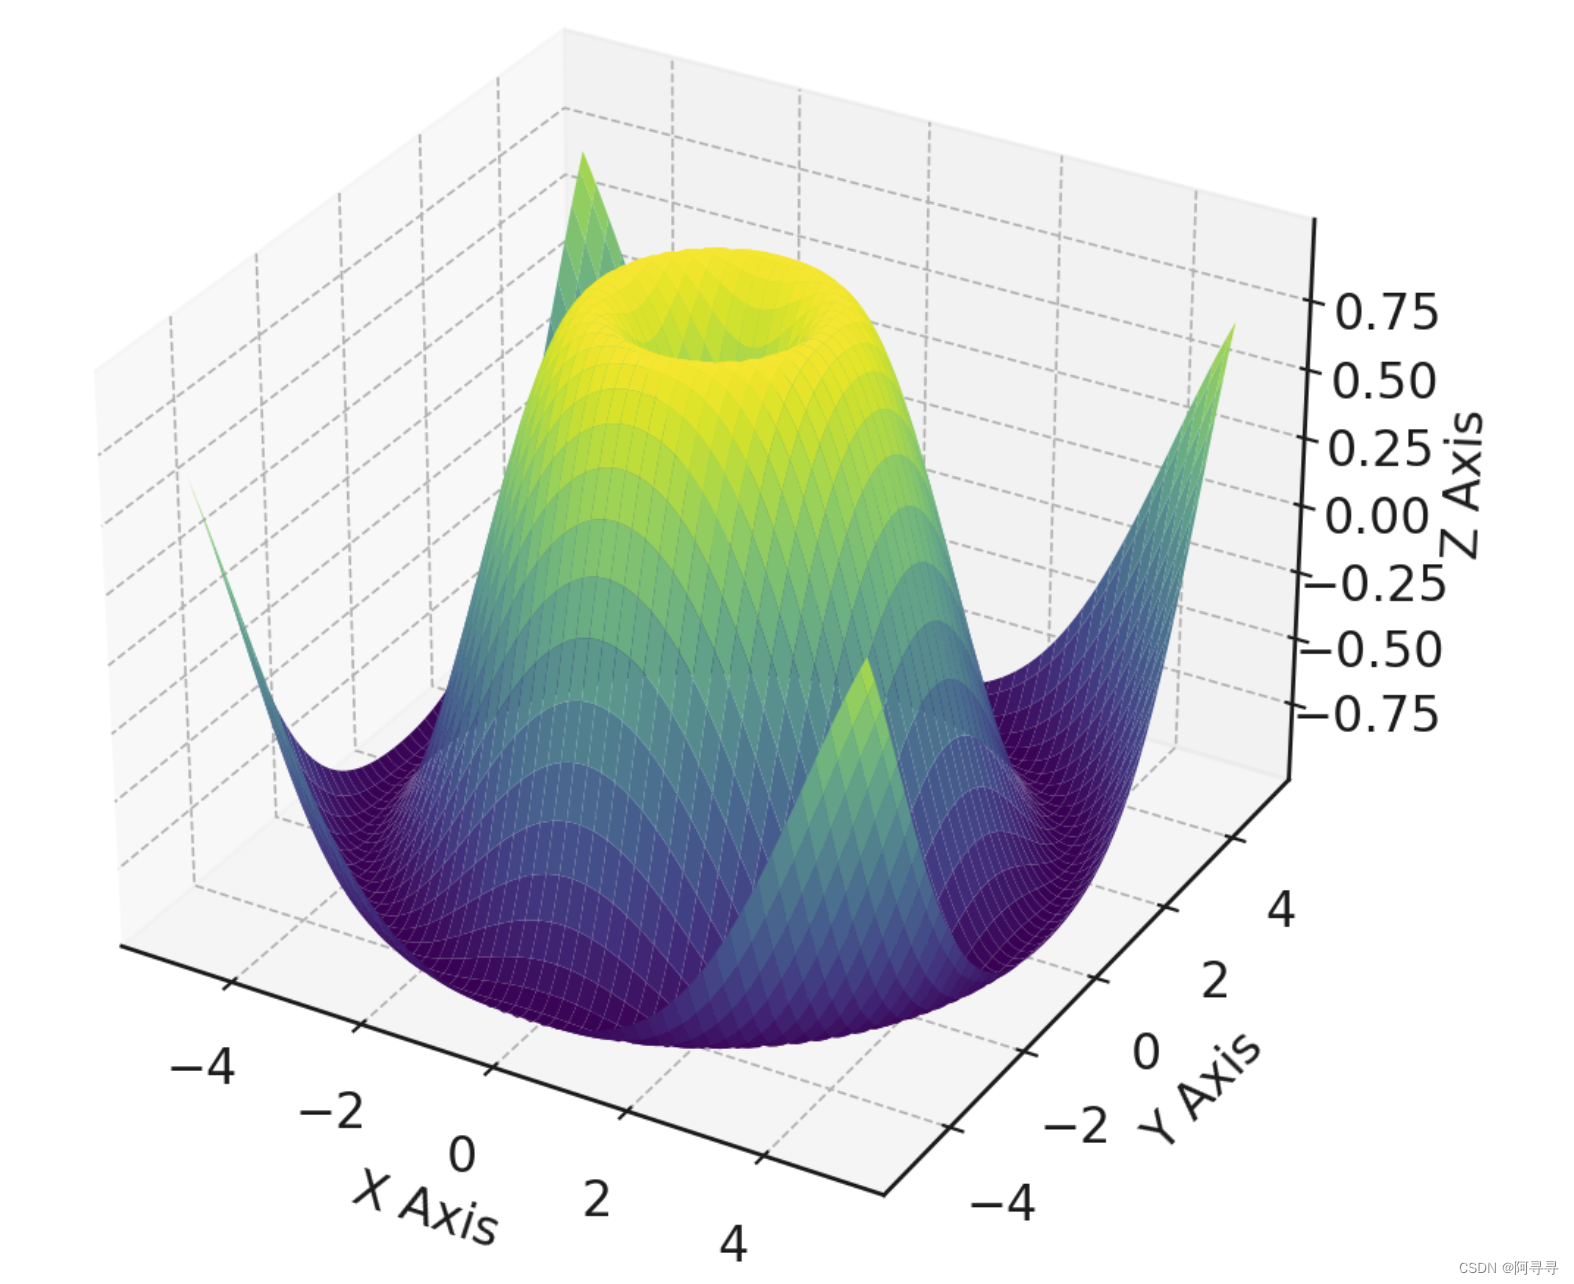
完整示例
import matplotlib.pyplot as plt
import numpy as np
from mpl_toolkits.mplot3d import Axes3D

# 创建图形和3D坐标轴
fig = plt.figure()
ax = fig.add_subplot(111, projection='3d')

# 准备数据
x = np.linspace(-5, 5, 100)
y = np.linspace(-5, 5, 100)
X, Y = np.meshgrid(x, y)
Z = np.sin(np.sqrt(X**2 + Y**2))

# 绘制曲面图
ax.plot_surface(X, Y, Z, cmap='viridis')

# 设置坐标轴标签
ax.set_xlabel('X Axis')
ax.set_ylabel('Y Axis')
ax.set_zlabel('Z Axis')

# 显示图形
plt.show()
这个示例将创建一个三维曲面图,其中曲面表示的是 Z = sin(sqrt(X^2 + Y^2)) 函数。
小提示
- 三维图形可能需要调整视角和缩放比例来获得最佳的可视效果。您可以在图形窗口中直接用鼠标调整这些参数。
- 三维图形的性能可能不如二维图形流畅,尤其是在处理大量数据时。适当减少数据点可以提高性能。

三、二维网格介绍
numpy 库中的 np.meshgrid 函数是一个非常有用的工具,它用于生成二维网格,这在数据可视化和数学建模中非常常见,特别是在绘制三维图形时。下面是对 np.meshgrid 的详细介绍:
基本概念
np.meshgrid 函数接受两个一维数组,并生成两个二维矩阵。这两个矩阵对应于两个数组中所有的 (x, y) 点对。换句话说,它可以帮助你创建一个“网格”,在这个网格上,你可以评估两个变量的函数。
参数
np.meshgrid 的主要参数是两个一维数组。例如,np.meshgrid(bs, ws) 中的 bs 和 ws 就是这样的数组。
bs:第一个输入数组。ws:第二个输入数组。
返回值
- 返回两个二维数组,其中每个数组都是输入数组的扩展版本。
- 第一个返回的数组是
bs的复制,其中每一行都是bs的副本。 - 第二个返回的数组是
ws的复制,其中每一列都是ws的副本。
使用示例
假设我们有两个一维数组 bs = [1, 2, 3] 和 ws = [4, 5, 6, 7],并且我们想要创建一个网格来评估某个函数 f(b, w) 在这个网格上的值。
import numpy as np

bs = [1, 2, 3]
ws = [4, 5, 6, 7]

B, W = np.meshgrid(bs, ws)

print("B =", B)
print("W =", W)
输出将是:
B = [[1 2 3]
     [1 2 3]
     [1 2 3]
     [1 2 3]]
W = [[4 4 4]
     [5 5 5]
     [6 6 6]
     [7 7 7]]
在这个例子中,B 和 W 就形成了一个网格,你可以在每个 (b, w) 点上计算函数 f 的值。
应用场景
在绘制三维图形时,np.meshgrid 尤其有用。例如,如果你想绘制一个由 bs 和 ws 变量定义的表面,你可以使用 np.meshgrid 来生成这个表面上每一点的坐标。然后,你可以使用这些坐标来计算函数值,并使用例如 matplotlib 的 plot_surface 函数来绘制这个表面。
总的来说,np.meshgrid 是一个在多维空间进行工作时不可或缺的工具,它让你能够方便地处理和可视化高维数据。
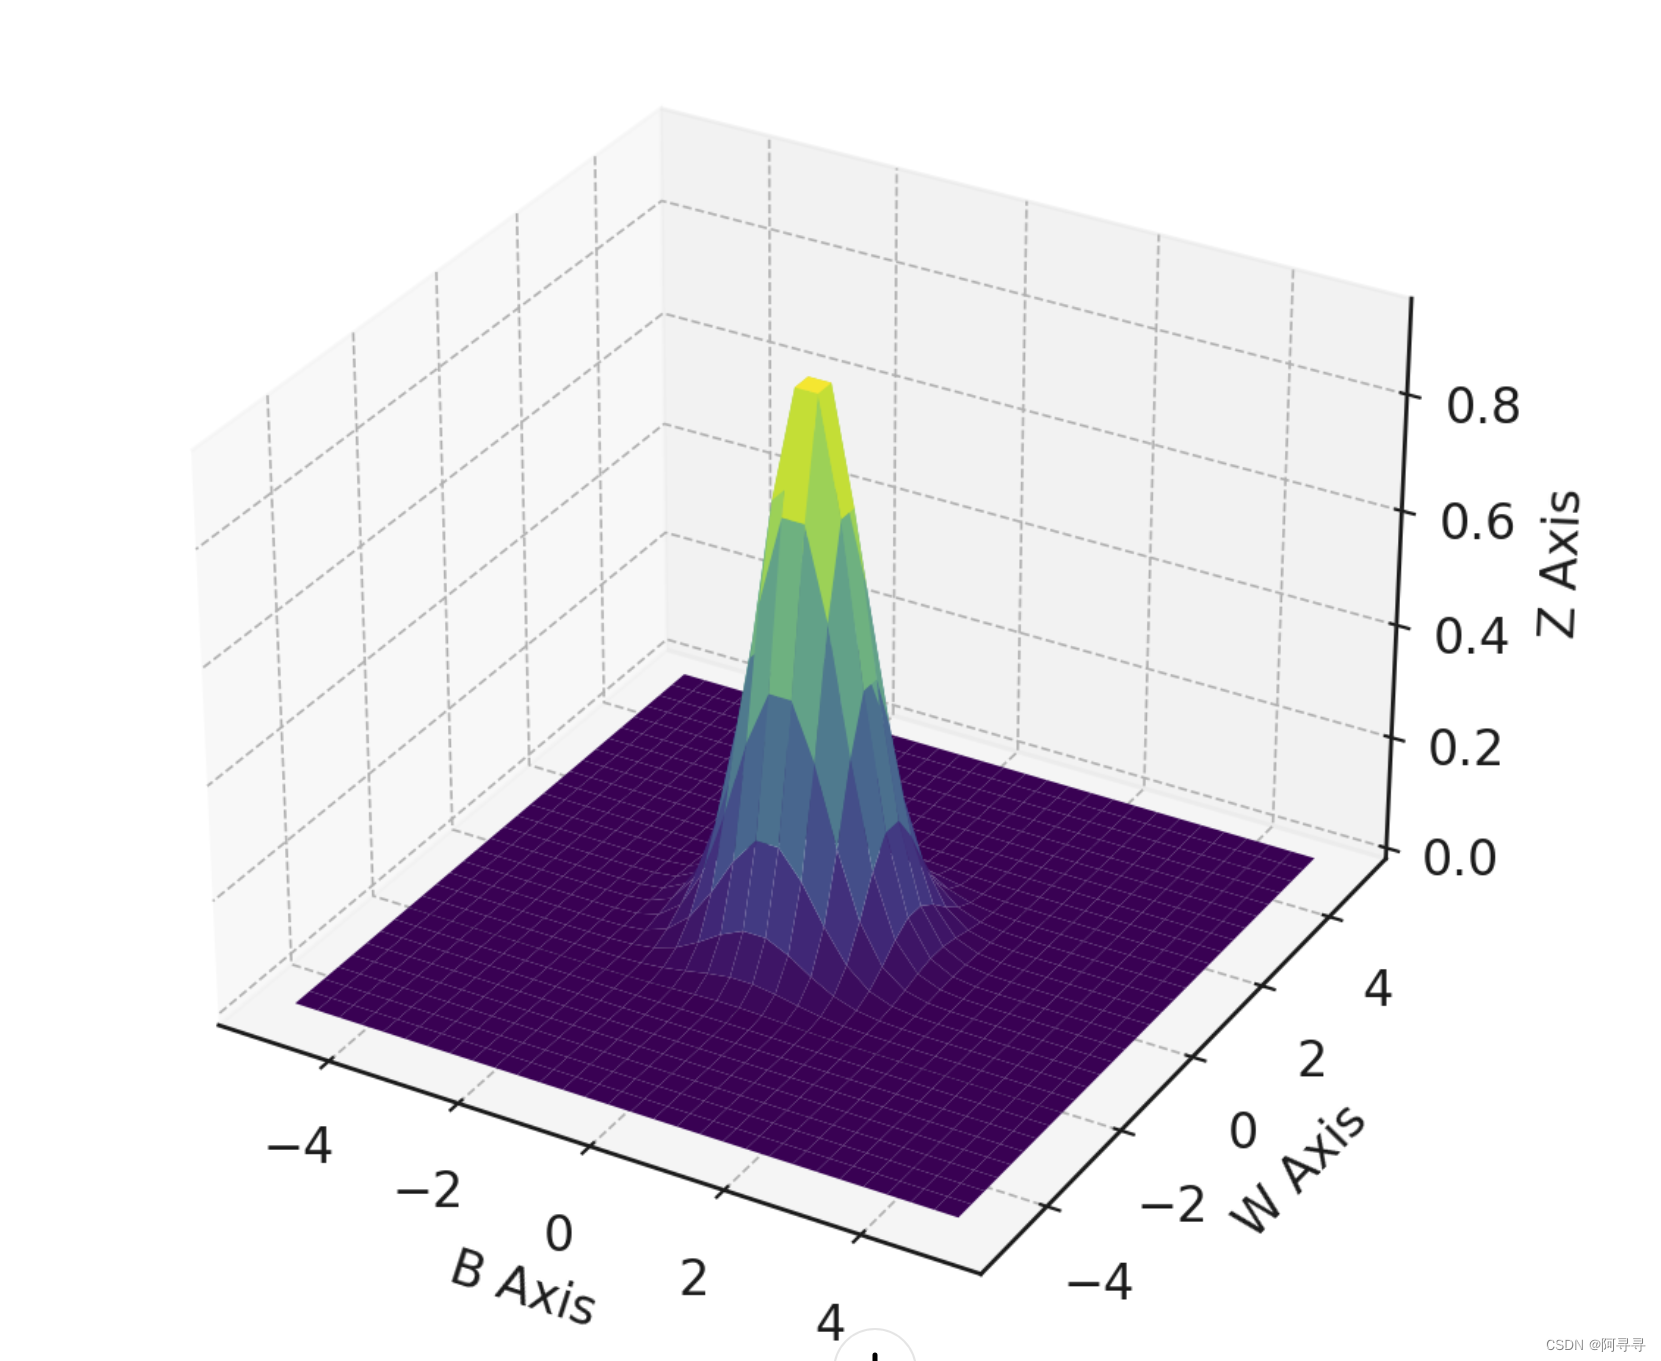
举例:二元高斯函数生成三维曲面
如下是一个使用 Python 和 Matplotlib 库,通过 np.meshgrid 创建三维曲面图的完整示例代码。这个示例展示了如何用二元高斯函数生成三维曲面:
import numpy as np
import matplotlib.pyplot as plt
from mpl_toolkits.mplot3d import Axes3D

# 定义一维数组
bs = np.linspace(-5, 5, 30)
ws = np.linspace(-5, 5, 30)

# 使用 np.meshgrid 生成网格
B, W = np.meshgrid(bs, ws)

# 定义一个二元高斯函数
def gaussian(b, w):
    return np.exp(-(b**2 + w**2))

# 计算函数值
Z = gaussian(B, W)

# 创建图形和3D坐标轴
fig = plt.figure()
ax = fig.add_subplot(111, projection='3d')

# 绘制曲面图
ax.plot_surface(B, W, Z, cmap='viridis')

# 设置坐标轴标签
ax.set_xlabel('B Axis')
ax.set_ylabel('W Axis')
ax.set_zlabel('Z Axis')

# 显示图形
plt.show()
这段代码首先定义了两个一维数组 bs 和 ws,它们分别表示两个变量的范围。然后,使用 np.meshgrid 函数生成一个网格,这个网格上的每个点对应于 (b, w) 坐标。接下来,我们定义了一个高斯函数,并在网格上的每个点计算这个函数的值。最后,使用 Matplotlib 的 plot_surface 方法绘制了这个函数的三维曲面图。可以运行这段代码以可视化二元高斯函数的曲面。

本文来自互联网用户投稿,该文观点仅代表作者本人,不代表本站立场。本站仅提供信息存储空间服务,不拥有所有权,不承担相关法律责任。 如若内容造成侵权/违法违规/事实不符,请联系我的编程经验分享网邮箱:chenni525@qq.com进行投诉反馈,一经查实,立即删除!
- Python教程
- 深入理解 MySQL 中的 HAVING 关键字和聚合函数
- Qt之QChar编码(1)
- MyBatis入门基础篇
- 用Python脚本实现FFmpeg批量转换
- try:创作助手-python制作一个购物网站。
- 蒙特卡洛方法:Python实现
- 利用C/C++实现的水波纹特效
- GBASE南大通用分享,如何添加主键或唯一约束
- XETUX软件 dynamiccontent.properties.xhtml RCE漏洞复现
- 变分贝叶斯近似
- 适用于 Mac 的 10 款顶级数据恢复软件分享
- HDU acm oj 2030-2040
- 分布式解决方案与实战
- 链表基础知识(二、双向链表头插、尾插、头删、尾删、查找、删除、插入)