文献速递:人工智能医学影像分割---基于合成MRI辅助的深度注意力全卷积网络的CT前列腺分割
文献速递:人工智能医学影像分割—基于合成MRI辅助的深度注意力全卷积网络的CT前列腺分割****
01文献速递介绍
Prostate cancer is the most common cancer and the second leading cause of cancer death among men in the United States.1 Depending on the risk of recurrence and extent of**disease, around 30% of prostate cancer patients receive radia tion therapy.2 External beam radiotherapy is a noninvasive modality which provides localized dose delivery, and has been widely adopted for the definitive treatment of prostate cancer. Prostate delineation is a prerequisite for treatment planning.3,4 In clinical practice, the prostate is contoured manually. Due to the low soft tissue contrast of CT images, prostate delineation suffers from inter- and intra-observervariability, and the delineation accuracy is highly dependent on the clinician’s expertise and experience.5 Studies shows that CT-defined prostate volume often overestimates the,prostate by over 30%.6,7 Computer-aided prostate segmenta tion methods have been developed to improve the accuracy of organ delineation.
前列腺癌是美国男性中最常见的癌症,也是癌症死亡的第二大原因。1 根据复发风险和疾病范围,大约30%的前列腺癌患者接受放射治疗。2 外照射放射治疗是一种非侵入性手段,提供局部剂量输送,已广泛应用于前列腺癌的确定性治疗。前列腺轮廓勾画是治疗计划的先决条件。3,4 在临床实践中,前列腺是手动勾画的。由于CT图像的低软组织对比度,前列腺轮廓勾画受到观察者之间和观察者内部的变异性影响,勾画准确性高度依赖于临床医生的专业知识和经验。5 研究表明,CT定义的前列腺体积通常高估前列腺超过30%。6,7 已经开发了计算机辅助的前列腺分割方法,以提高器官轮廓勾画的准确性。
Title
题目
CT prostate segmentation based on synthetic MRI-aided deep attention fullyconvolution network
基于合成MRI辅助的深度注意力全卷积网络的CT前列腺分割
Methods
方法
We developed a prostate segmentation strategy which employs an sMRI aided deep attention network to accurately segment the prostate on CT. Our method consists of three major steps. First, a cycle generative adversarial network was used to estimate an sMRI from CT images. Second, a deep attention fully convolution network was trained based on sMRI and the pros tate contours deformed from MRIs. Attention models were introduced to pay more attention to pros tate boundary. The prostate contour for a query patient was obtained by feeding the patient’s CT images into the trained sMRI generation model and segmentation model.
我们开发了一种前列腺分割策略,该策略采用sMRI辅助的深度注意力网络在CT上准确地分割前列腺。我们的方法包括三个主要步骤。首先,使用循环生成对抗网络从CT图像估计sMRI。其次,基于sMRI和从MRI变形来的前列腺轮廓训练了一个深度注意力全卷积网络。引入了注意力模型,以更多地关注前列腺边界。通过将查询患者的CT图像输入到训练好的sMRI生成模型和分割模型中,获得前列腺轮廓。
Results
结果
The segmentation technique was validated with a clinical study of 49 patients by leave-one out experiments and validated with an additional 50 patients by hold-out test. The Dice similarity
coefficient, Hausdorff distance, and mean surface distance indices between our segmented and deformed MRI-defined prostate manual contours were 0.92 0.09, 4.38 4.66, and 0.62 0.89 mm, respectively, with leave-one-out experiments, and were 0.91 0.07, 4.57 3.03,and 0.62 0.65 mm, respectively, with hold-out test.
该分割技术通过对49名患者的临床研究进行留一实验进行了验证,并通过对额外50名患者的保留测试进行了验证。我们的分割与经变形的MRI定义的前列腺手动轮廓之间的Dice相似系数、豪斯多夫距离和平均表面距离指标分别为0.92 ± 0.09、4.38 ± 4.66和0.62 ± 0.89毫米,使用留一实验得出,分别为0.91 ± 0.07、4.57 ± 3.03和0.62 ± 0.65毫米,使用保留测试得出。
Conclusions
结论
We have proposed a novel CT-only prostate segmentation strategy using CT-based sMRI, and validated its accuracy against the prostate contours that were manually drawn on MRI images and deformed to CT images. This technique could provide accurate prostate volume for treat ment planning without requiring MRI acquisition, greatly facilitating the routine clinical workflow. ? 2019 American Association of Physicists in Medicine [https://doi.org/10.1002/mp.13933]
Key words: computed tomography, CT-based synthetic MRI, deep attention network, prostate segmentation
我们提出了一种新颖的仅使用CT的前列腺分割策略,该策略使用基于CT的sMRI,并针对在MRI图像上手动绘制并变形到CT图像的前列腺轮廓验证了其准确性。这种技术可以在不需要MRI采集的情况下提供准确的前列腺体积,用于治疗计划,极大地促进了常规临床工作流程。
Figure
图
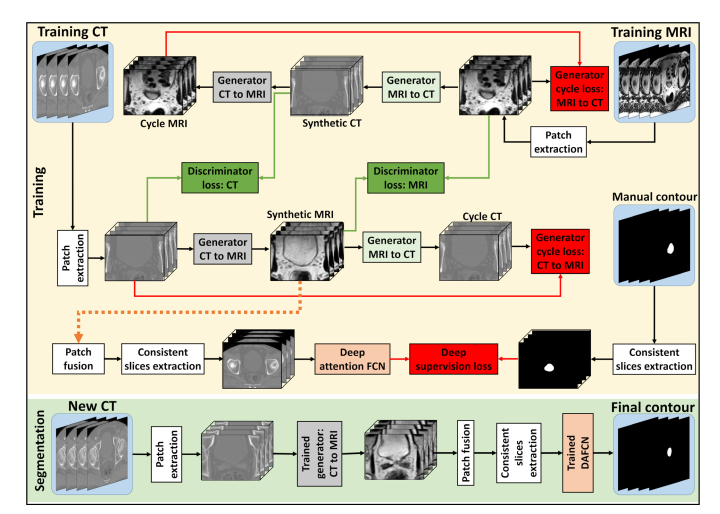
FIG. 1. The schematic flow diagram of the proposed method. The first row shows the synthetic magnetic resonance imaging generation using CycleGAN, and the training procedure of segmentation model. The second row shows the segmentation stage for a new patient’s computed tomography image.
图1. 所提出方法的示意流程图。第一行展示了使用CycleGAN生成合成磁共振成像的过程和分割模型的训练程序。第二行展示了对新患者的计算机断层扫描图像进行分割的阶段。
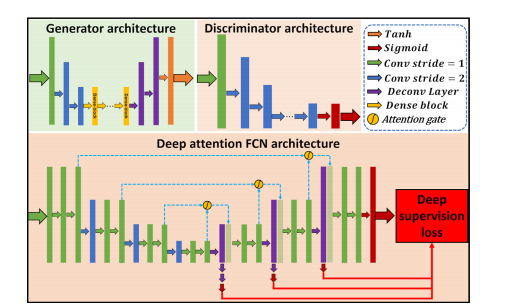
FIG. 2. The architectures of proposed networks.
图2. 所提出网络的架构。
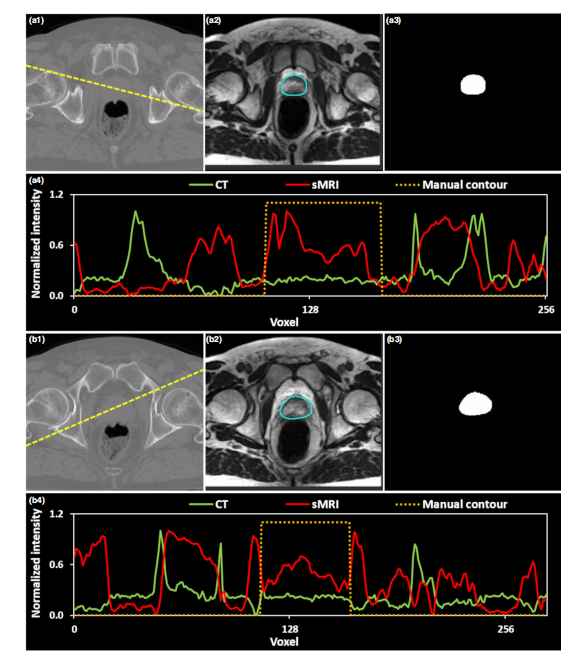
FIG. 3. Visual results of generated synthetic magnetic resonance imaging (sMRI). (a1) and (b1) show the original computed tomography (CT) image at two axial levels, (a2) and (b2) show the generated sMRI, (a3) and (b3) show the deformed manual contour, (a4) and (b4) show the plot profiles of CT, sMRI, and manual contour of the yellow dashed line in (a1) and (b1), respectively.
图3. 生成的合成磁共振成像(sMRI)的视觉结果。(a1) 和 (b1) 展示了两个轴向层面的原始计算机断层扫描(CT)图像,(a2) 和 (b2) 展示了生成的sMRI,(a3) 和 (b3) 展示了变形的手动轮廓,(a4) 和 (b4) 分别展示了 (a1) 和 (b1) 中黄色虚线的CT、sMRI和手动轮廓的剖面图。
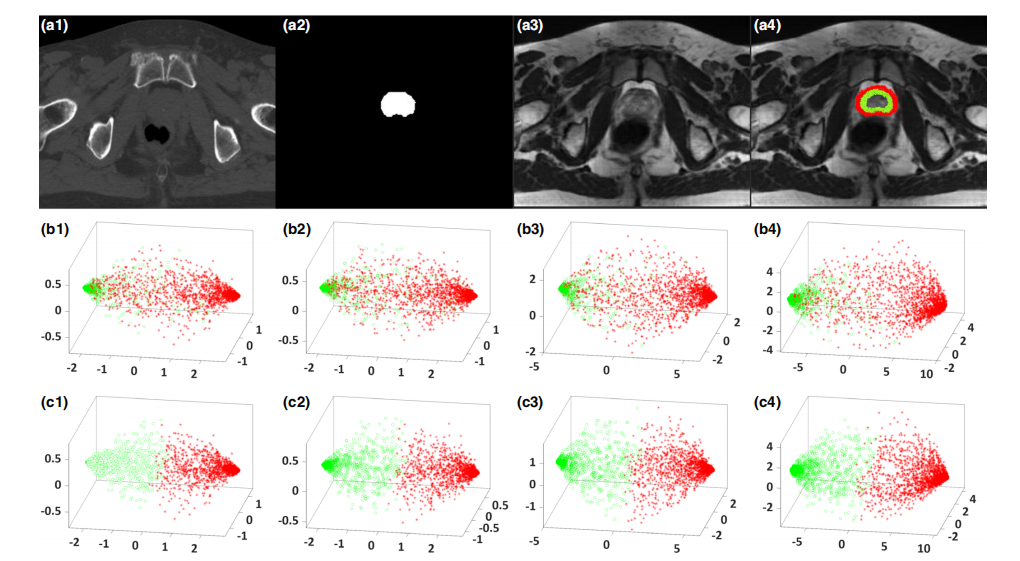
FIG. 4. An illustrative example of the benefit of our deep attention fully convolution network (DAFCN) compared with DSFCN without attention gate, (a1) shows the original CT image in transverse plane. (a2) shows corresponding manual contour, (a3) shows the generated synthetic magnetic resonance imaging (sMRI), (a4) shows the sample patches’ central positions drawn from sMRI, where the samples belonging to the prostate are highlighted by green circles, and the samples belonging to the non-prostate are highlighted by red asterisks. (b1–b4) show the scatter plots of the first three principal components of corresponding patch samples in feature maps at each decompression path outputs by using a DSFCN, respectively. (c1–c4) show the scatter plots of first three principal compo nents of corresponding patch samples in the feature maps at each decompression path outputs by using our DAFCN, respectively. The position of the viewer in
(b1–b4) and (c1–c4) is azimuth = 10° and elevation = 30°.
图4. 我们的深度注意力全卷积网络(DAFCN)与未使用注意力门的DSFCN相比的优势示例,(a1) 展示了横断面上的原始CT图像。(a2) 展示了相应的手动轮廓,(a3) 展示了生成的合成磁共振成像(sMRI),(a4) 展示了从sMRI中提取的样本补丁的中心位置,其中属于前列腺的样本用绿色圆圈突出显示,非前列腺的样本用红色星号突出显示。(b1-b4) 分别展示了使用DSFCN在每个解压路径输出的特征图中相应补丁样本的前三个主成分的散点图。(c1-c4) 分别展示了使用我们的DAFCN在每个解压路径输出的特征图中相应补丁样本的前三个主成分的散点图。在(b1-b4)和(c1-c4)中,观察者的位置为方位角=10°和仰角=30°。
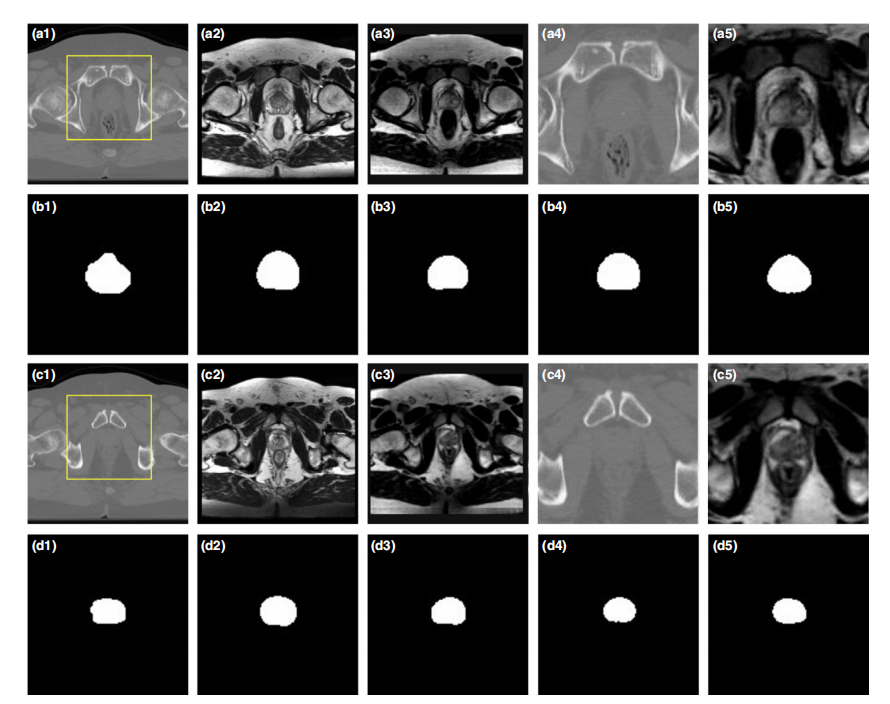
FIG. 5. Comparison of the proposed method with state-of-the-art U-Net model. (a1) and (c1) show the computed tomography (CT) image. (a2) and (c2) show the magnetic resonance imaging (MRI). (a3) and (c3) show the synthetic MRI (sMRI). (a4) and (c4) show the zoomed-in region of CT of yellow rectangle shown in (a1) and (c1). (a5) and (c5) show the zoomed-in region of sMRI of that yellow rectangle. (b1–b5) and (d1-d5) show the zoomed-in binary mask of manual con tour, segmented contour obtained by CT U-Net, sMRI U-Net, CT deep attention fully convolution network (DAFCN), and sMRI DAFCN, respectively.
图5. 将所提出的方法与最新的U-Net模型进行比较。(a1)和(c1)展示了计算机断层扫描(CT)图像。(a2)和(c2)展示了磁共振成像(MRI)。(a3)和(c3)展示了合成MRI(sMRI)。(a4)和(c4)展示了(a1)和(c1)中黄色矩形框内的CT的放大区域。(a5)和(c5)展示了那个黄色矩形框内的sMRI的放大区域。(b1–b5)和(d1-d5)分别展示了手动轮廓的放大二值掩膜、CT U-Net获得的分割轮廓、sMRI U-Net、CT深度注意力全卷积网络(DAFCN)和sMRI DAFCN的分割轮廓。
Table
表
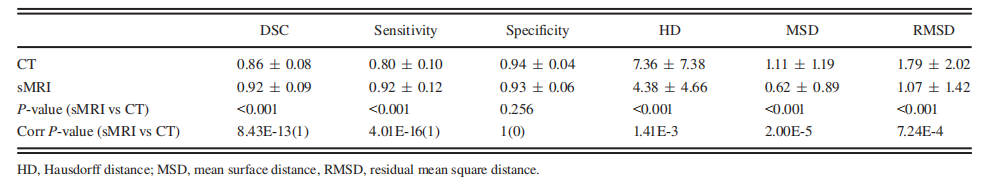
TABLE I. Numerical comparison by using a deep attention fully convolution network on computed tomography (CT) and synthetic magnetic resonance imaging(sMRI) data.
表I. 使用深度注意力全卷积网络在计算机断层扫描(CT)和合成磁共振成像(sMRI)数据上的数值比较。
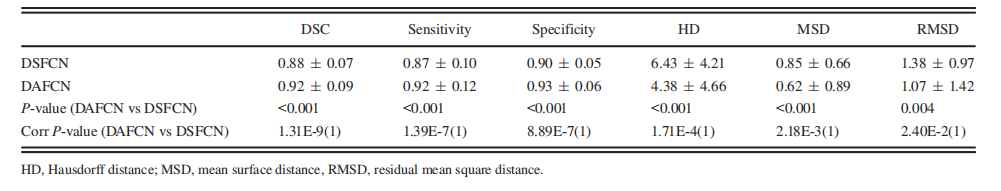
TABLE II. Numerical comparison by using deep attention fully convolution network (DAFCN) and DSFCN on synthetic magnetic resonance imaging (sMRI)data.
表 II. 使用深度注意力全卷积网络(DAFCN)和DSFCN在合成磁共振成像(sMRI)数据上的数值比较。
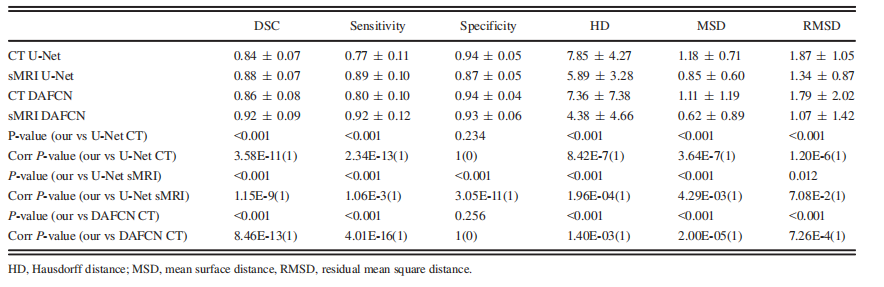
TABLE III. Quantitative metrics comparison of our proposed algorithm versus U-Net on both computed tomography (CT) and synthetic mag netic resonance imag ing (sMRI) by leave-one-out experiments.
表III. 在计算机断层扫描(CT)和合成磁共振成像(sMRI)上,通过留一实验对我们提出的算法与U-Net进行的定量指标比较。
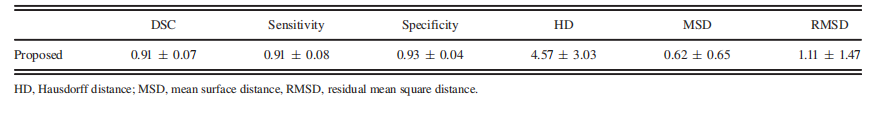
TABLE IV. Quantitative metrics of our proposed algorithm on hold-out test.
表IV. 在保留测试集上我们提出的算法的定量指标。
本文来自互联网用户投稿,该文观点仅代表作者本人,不代表本站立场。本站仅提供信息存储空间服务,不拥有所有权,不承担相关法律责任。 如若内容造成侵权/违法违规/事实不符,请联系我的编程经验分享网邮箱:chenni525@qq.com进行投诉反馈,一经查实,立即删除!