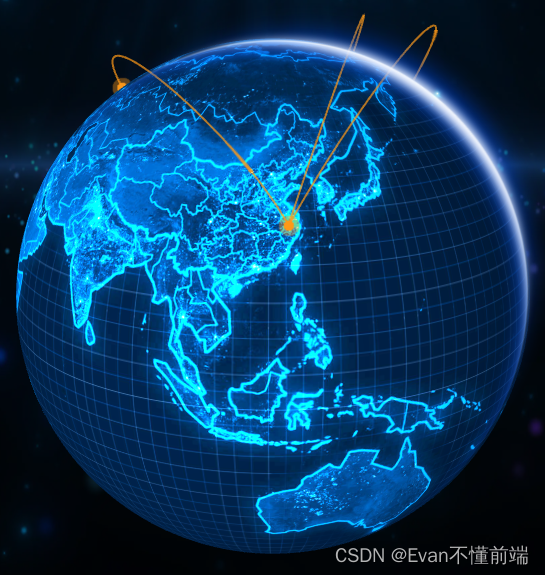
使用 React 和 ECharts 创建地球模拟扩散和飞线效果
发布时间:2023年12月18日
在本博客中,我们将学习如何使用 React 和 ECharts 创建一个酷炫的地球模拟扩散效果。我们将使用 ECharts 作为可视化库,以及 React 来构建我们的应用。地球贴图在文章的结尾。
最终效果

准备工作
首先,确保你已经安装了 React,并创建了一个新的 React 应用。如果你还没有安装 React,可以使用以下命令:
npx create-react-app earth-echarts-demo
然后进入项目目录:
cd earth-echarts-demo
接下来,我们需要安装 ECharts:
npm install echarts --save
创建 EarthEcharts 组件
在你的 React 应用中,创建一个名为 EarthEcharts.js 的组件文件,并将以下代码添加到该文件中:
import React from 'react';
import { Box } from '@mui/material';
import * as echarts from 'echarts';

export default function EarthEcharts() {
  // 这里放入你提供的 EarthEcharts 组件代码
}

export default EarthEcharts;
组件代码解析
现在让我们来解析 EarthEcharts 组件的代码。
数据准备
首先,我们需要准备一些地点的数据和连接这些地点的数据。这些数据将用于创建地球上的点和飞线效果。
const areaPointes = [
  {
    name: '杭州',
    point: [120.12, 30.16],
    itemStyleColor: '#ff9917',
    labelText: '杭州'
  },
  {
    name: '德国',
    point: [13.402393, 52.518569, 0],
    itemStyleColor: '#ff9917',
    labelText: '德国'
  },
  {
    name: '美国',
    point: [-100.696295, 33.679979, 0],
    itemStyleColor: '#ff9917',
    labelText: '美国'
  }
];

// 设置地理坐标映射
let geoCoordMap: any = {
   杭州: [120.12, 30.16],
   美国: [-100.696295, 33.679979],
   德国: [13.402393, 52.518569],
   加拿大: [-102.646409, 59.994255]
 };

const HZData = [
  [{ name: '杭州' }, { name: '加拿大', value: 80 }],
  [{ name: '杭州' }, { name: '美国', value: 100 }],
  [{ name: '杭州' }, { name: '德国', value: 95 }]
];

let convertData = function (data: any) {
   let res = [];

   for (let i = 0; i < data.length; i++) {
     let dataItem = data[i];
     let fromCoord = geoCoordMap[dataItem[1].name];
     let toCoord = geoCoordMap[dataItem[0].name];

     if (fromCoord && toCoord) {
       res.push([fromCoord, toCoord]);
     }
   }
    return res;
  };
创建 ECharts 图表
然后,我们根据上面的数据创建 ECharts 图表。在 render 方法中,我们设置了地球的外观和视角控制参数,并创建了散点和线条系列。
 const series = areaPointes.map((item) => {
    return {
      name: item.name, // 是否显示左上角图例
      type: 'scatter3D',
      coordinateSystem: 'globe',
      blendMode: 'source-over',
      symbol: 'circle',
      animation: true,
      symbolSize: 10, // 点位大小
      itemStyle: {
        color: item.itemStyleColor, // 各个点位的颜色设置
        opacity: 1, // 透明度
        borderWidth: 0, // 边框宽度
        borderColor: 'rgba(255,255,255,0.8)', //rgba(180, 31, 107, 0.8)
        shadowBlur: 20, // 设置发光效果的模糊程度
        shadowColor: 'rgba(255, 153, 23, 0.8)', // 设置发光的颜色
        emphasis: {
          // 强调显示效果
          label: {
            show: true
          },
          itemStyle: {
            color: '#fff',
            borderColor: 'red',
            borderWidth: 20
          }
        }
      },

      animationDelay: 1000, // 动画延迟1秒播放
      label: {
        show: false, // 是否显示字体
        position: 'left', // 字体位置。top、left、right、bottom
        formatter: item.labelText, // 具体显示的值
        textStyle: {
          color: '#fff', // 字体颜色
          borderWidth: 0, // 字体边框宽度
          borderColor: '#fff', // 字体边框颜色
          fontFamily: 'sans-serif', // 字体格式
          fontSize: 18, // 字体大小
          fontWeight: 700 // 字体加粗
        }
      },
      data: [item.point] // 数据来源
    };
  });

// 设置飞线
const lineSeries = [];
[['杭州', NNData]].forEach(function (item) {
  lineSeries.push({
    type: 'lines3D',
    effect: {
      show: true,
      period: 3,
      trailLength: 0.1
    },
     lineStyle: {
        //航线的视图效果
        color: '#ff9917',
        width: 2,
        opacity: 0.7
      },
    data: convertData(item[1])
  });
});
//  设置扩散坐标样式
const middleSeries = series.map((item) => {
    return {
      ...item,
      symbolSize: 20,
      itemStyle: {
        ...item.itemStyle,
        opacity: 0.4 // 透明度
      }
    };
  });
最终配置参数
最后,我们将所有的系列合并到 ECharts 的配置对象中,并返回一个包含地球图和图例的 React 组件。
const option = {
  backgroundColor: 'transparent',
  //地球配置
  globe: {
      //地球的半径。单位相对于三维空间
      globeRadius: 56,
      // 基础图片
      baseTexture: '/src/assets/images/widget-images/earth-skin-blue.jpg',
      // heightTexture: '/src/assets/images/widget-images/lines.png',
      // 地球顶点位移的大小。
      displacementScale: 0.1,
      // 地球中三维图形的着色效果
      // 'color' 只显示颜色,不受光照等其它因素的影响。
      // 'lambert' 通过经典的 lambert 着色表现光照带来的明暗。
      // 'realistic' 真实感渲染
      shading: 'lambert',
      //环境贴图。支持纯色、渐变色、全景贴图的 url
      // environment: '/src/assets/images/widget-images/earth-background.jpg',
      // displacementTexture: '/src/assets/images/widget-images/lines.png',
      //roughness属性用于表示材质的粗糙度,0为完全光滑,1完全粗糙,中间的值则是介于这两者之间
      realisticMaterial: {
        roughness: 0.1
      },
      atmosphere: {
        show: false // 大气层
      },
      light: {
        // 场景主光源的设置
        main: {
          // 主光源的颜色
          color: '#fff', // 光照颜色
          intensity: 0.8, // 光照强度
          shadow: true, // 是否显示阴影
          alpha: 40, // 主光源绕 x 轴,即上下旋转的角度
          beta: -30 //主光源绕 y 轴,即左右旋转的角度。
        },
        // 全局的环境光设置。
        ambient: {
          // /环境光的强度
          intensity: 1
        }
      },
      viewControl: {
        center: [0, 15, 0],
        autoRotate: true, // 是否开启视角绕物体的自动旋转查看
        autoRotateSpeed: 2, //物体自转的速度,单位为角度 / 秒,默认为10 ,也就是36秒转一圈。
        autoRotateAfterStill: 2, // 在鼠标静止操作后恢复自动旋转的时间间隔,默认 3s
        rotateSensitivity: 2, // 旋转操作的灵敏度,值越大越灵敏.设置为0后无法旋转。[1, 0]只能横向旋转.[0, 1]只能纵向旋转
        targetCoord: [116.46, 15], // 定位到北京
        zoomSensitivity: 0 // 禁止缩放
      }
    },
  series: [...series, ...middleSeries, ...lineSeries]
};

return (
  <Box
    sx={{
      width: '100%',
      height: '100%',
      position: 'relative'
    }}
  >
    <CommonChart option={option} width="100%" height="100%" />
  </Box>
);
引入 EarthEcharts 组件
最后,将 EarthEcharts 组件引入到你的应用中的任何页面或组件中。你可以在需要的地方使用它,例如在一个页面组件中:
import React from 'react';
import EarthEcharts from './EarthEcharts';

function App() {
  return (
    <div className="App">
      <EarthEcharts />
    </div>
  );
}

export default App;
现在,你的 React 应用应该显示一个带有地球模拟扩散效果的图表了!
这就是如何使用 React 和 ECharts 创建地球模拟扩散效果的简要教程。希望这个示例对你有所帮助,你可以根据自己的需求进
地球贴图

文章来源:https://blog.csdn.net/m0_73117087/article/details/134324520
本文来自互联网用户投稿,该文观点仅代表作者本人,不代表本站立场。本站仅提供信息存储空间服务,不拥有所有权,不承担相关法律责任。 如若内容造成侵权/违法违规/事实不符,请联系我的编程经验分享网邮箱:chenni525@qq.com进行投诉反馈,一经查实,立即删除!
本文来自互联网用户投稿,该文观点仅代表作者本人,不代表本站立场。本站仅提供信息存储空间服务,不拥有所有权,不承担相关法律责任。 如若内容造成侵权/违法违规/事实不符,请联系我的编程经验分享网邮箱:chenni525@qq.com进行投诉反馈,一经查实,立即删除!
最新文章
- Python教程
- 深入理解 MySQL 中的 HAVING 关键字和聚合函数
- Qt之QChar编码(1)
- MyBatis入门基础篇
- 用Python脚本实现FFmpeg批量转换
- 如何通过蓝牙串口启动智能物联网?
- NVIDIA Container Toolkit(NVIDIA Docker)
- Ubuntu本地快速搭建web小游戏网站,公网用户远程访问
- c语言插入排序及希尔排序详解
- 浙大恩特客户资源管理系统CrmBasicAction.entcrm接口存在任意文件上传漏洞
- 【面试突击】生产环境面试实战
- 技术硬实力,阿里巴巴为什么要开源Spring Cloud Alibaba?
- 在linux操作系统上安装服务器相关软件
- Mysql 将数据按照年月分组 统计
- 计算机组成原理-进位计数制(进制表示 进制转换 真值和机器树)