1.4.1机器学习——梯度下降+α学习率大小判定
1.4.1梯度下降
4.1、梯度下降的概念
※【总结一句话】:系统通过自动的调节参数w和b的值,得到最小的损失函数值J。
如下:是梯度下降的概念图。
-
我们有一个损失函数 J(w,b),包含两个参数w和b(你可以想象成J(w,b) = w*x + b) ,我们想要找到最合适的w和b,尝试最小化损失函数 J(w,b)的值
-
”梯度下降“:梯度下降(gradient descent)在机器学习中应用十分的广泛,不论是在线性回归还是Logistic回归中,它的主要目的是通过迭代找到目标函数的最小值,或者收敛到最小值。
-
它还适用于有多个参数的(如图:w1~ wn,b) :梯度下降的任务是调节w1 ~ wn 和 参数 b 的值,最小化损失函数的值

- 梯度下降法是用来计算损失函数最小值的。它的思路很简单,想象在山顶放了一个球,一松手它就会顺着山坡最陡峭的地方滚落到谷底:

4.2、梯度下降概述

- J(w,b) = wx + b : 我们开始的时候w和b可以设置为任意值。(这里我们设置 w=0 , b = 0)
- “梯度下降”要做的就是:通过迭代不断的调整 w和b 的值,去尽量的降低损失函数J(w,b)
- 直到我们的损失函数J(w,b) 达到/接近 “谷底”/最小值
- 【※注意】 :损失函数可能不仅仅是一个如右图的抛物线,也可能是“高尔夫球场图”,这样的话minimum最小值的个数就不仅仅是一个了

“高尔夫球场图”
-
图中XYZ轴分别代表:W,b , 损失函数 J(w,b)的值
-
他不是一个 “平方误差损失函数”(线性回归使用 平方误差损失函数)图,因为 “平方误差损失函数”常常以抛物线 / 吊床 的形状结束
-
这个小人站在哪的起始点取决于你选择的参数w 和 b的起始值
-
两个谷底最低点都是局部最优解
1.4.2 理解梯度下降+梯度下降偏导的意义+α学习率
- 图解定义:

- 对梯度下降公式算法的解读:
- 其中参数 w和b 是一个同步进行 修改/微调 的。(同步进行,就是计算w和b的更新的两个公式是同步计算 的)
- 重复以上两个公式,直到达到结果收敛为止
- 在收敛重复这个公式的过程中,在计算tmp_w 和tmp_b中 的w是上一次迭代的w的值,只有tmp_w 和tmp_b都计算完成才会进行更新
- 你可能存在疑问:为什么不要用中间值 tmp_w 和wmp_b,直接就是 w = w - α…;b= b - α…不行吗???
- 答:你提问的很好。但是在这个梯度下降w,b迭代执行过程中,w和b同时参与了w,b的计算。
- 简单的说如下图,以W为例,加入在第i次迭代的情况下:
- 在第i次迭代的情况下执行完第一步w = w -0.2 后(假设这时候 J(w,b) = 0.2),
- 执行第二步 b = b - J(w,b) 的时候,你想放 执行w = w -0.2 更新之前的值 or 更新之后的值???
- 每一次迭代,在这第i次中,w 和 b对应的是第i -1次的值,在第i次迭代结束时才一起更新
- 如果不借用中间值 tmp_w 和 tmp_b,那么w 和 b 的最终值 就会受到影响

为了方便理解α(学习率),我们这里把b设置为0,只考虑有w的一维情况
-
其中α:称为学习率(粉色框内容),通常这个值在 0~1 之间,是控制w和b的调参步长
- 合适:

过程解释:
红框中:是求w的偏导,这里求完偏导知道是>0
α永远是 大于0 小于1 的数
然后w = w - α(正数) ====> w变小
所以就实现了微调

当W的偏导< 0 时:
红框中:是求w的偏导,这里求完偏导知道是<0α永远是 大于0 小于1 的数
然后w = w - α(负数) ====> w变大
所以就实现了微调.

-
如果α非常大:那么这个是一个非常激进的梯度下降的过程,步长会非常大,反而会越过谷底,不断上升:+
吴恩达老师的解释:
? 如果α过大/过大的步长:
? 会导致超过 , 并且从来不会达到最小值。
? 不能直线收敛,甚至是发散
- 合适:

-
如果α非常小:比如 α = 0.0001 就过于小了,迭代 20 次后离谷底还很远,实际上 100 次后都无法到达谷底:
梯度下降会起作用,但是需要很长的时间
吴恩达的解释:
? 如果α 步长太小,会实现收敛,但是这个收敛的过程会很慢很慢
- **总结:**不同的步长α ,随着迭代次数的增加,会导致被优化函数f(x) 的值有不同的变化:

关于α选择以及判定的 详细内容看: 2.2.3机器学习—— 判定梯度下降是否收敛 + α学习率的选择
1.4.3 用于线性回归的梯度下降

-
公式推到来源:

-
那么 线性回归梯度下降就是:
重复对w 和 b 执行更新直到收敛

- 当使用线性回归的平方误差损失函数时,全局只有一个最低点

- 当使用非平方误差函数时,就是非线性回归梯度下降的时候就会出现 >=1 的局部最优解

1.4.4 线性回归的梯度下降的应用
- 等高线最中心那个圈是 损失函数值最小的点,Cost值越小,说明线性回归的拟合越好,直到我们达到全局最小值
- 比如当 Size in feet 是1250 ,对应的回归预测值是 250 K

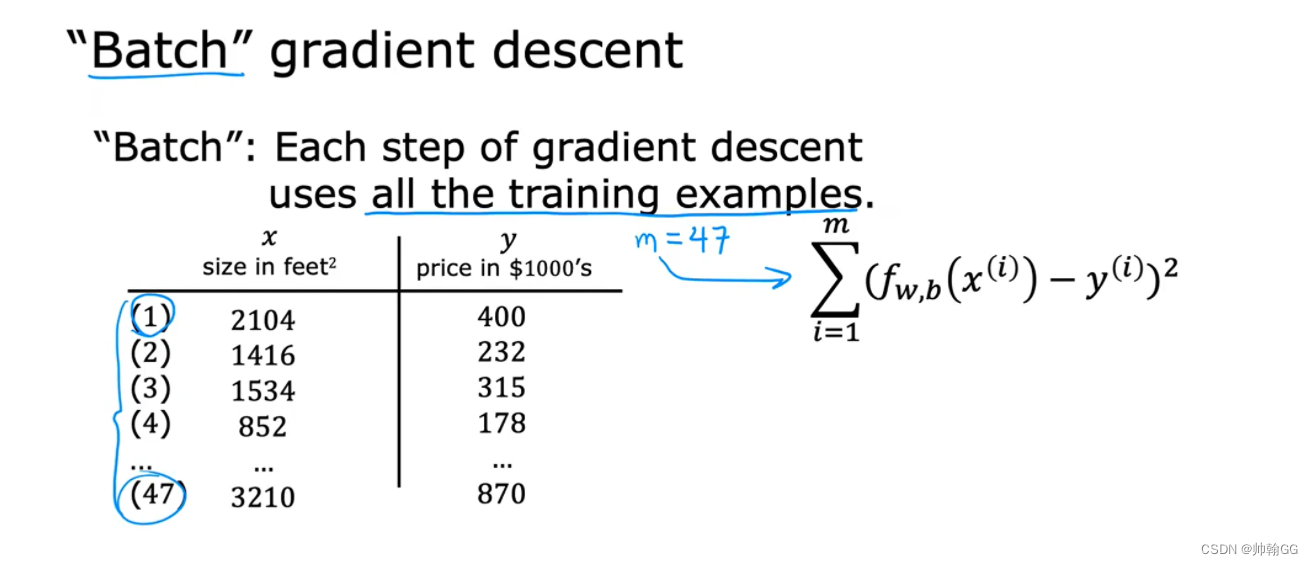
- “批量梯度下降”:每一次的梯度下降使用的是全部的训练的数据:
- 当计算 w 和 b 的偏导时,我们从 1 ~ m 所有的数据都计算上,然后相加求平均

※1.4.5 线性回归的梯度下降函数的代码实现
1、求损失函数
求损失函数代码如下:
def compute_cost(x, y, w, b):
    """
    Computes the cost function for linear regression.

    Args:
      x (ndarray (m,)): Data, m examples
      y (ndarray (m,)): target values
      w,b (scalar)    : model parameters

    Returns
        total_cost (float): The cost of using w,b as the parameters for linear regression
               to fit the data points in x and y
    """
    # number of training examples
    m = x.shape[0]

    cost_sum = 0
    for i in range(m):
        f_wb = w * x[i] + b
        cost = (f_wb - y[i]) ** 2
        cost_sum = cost_sum + cost
    total_cost = (1 / (2 * m)) * cost_sum

    return total_cost
2、求偏导 / 梯度
※求偏导代码如下:
def compute_gradient(x, y, w, b):
    """
    Computes the gradient for linear regression
    Args:
      x (ndarray (m,)): Data, m examples
      y (ndarray (m,)): target values
      w,b (scalar)    : model parameters
    Returns
      dj_dw (scalar): The gradient of the cost w.r.t. the parameters w
      dj_db (scalar): The gradient of the cost w.r.t. the parameter b
     """

    # Number of training examples
    m = x.shape[0]
    dj_dw = 0
    dj_db = 0

    for i in range(m):
        f_wb = w * x[i] + b
        dj_dw_i = (f_wb - y[i]) * x[i]
        dj_db_i = f_wb - y[i]
        dj_db += dj_db_i
        dj_dw += dj_dw_i
    dj_dw = dj_dw / m
    dj_db = dj_db / m

    return dj_dw, dj_db
3、梯度下降函数
def gradient_descent(x, y, w_in, b_in, alpha, num_iters, cost_function, gradient_function):
    """
    Performs gradient descent to fit w,b. Updates w,b by taking
    num_iters gradient steps with learning rate alpha

    Args:
      x (ndarray (m,))  : Data, m examples
      y (ndarray (m,))  : target values
      w_in,b_in (scalar): initial values of model parameters
      alpha (float):     Learning rate
      num_iters (int):   number of iterations to run gradient descent
      cost_function:     function to call to produce cost
      gradient_function: function to call to produce gradient

    Returns:
      w (scalar): Updated value of parameter after running gradient descent
      b (scalar): Updated value of parameter after running gradient descent
      J_history (List): History of cost values
      p_history (list): History of parameters [w,b]
      """

    w = copy.deepcopy(w_in) # avoid modifying global w_in
    # An array to store cost J and w's at each iteration primarily for graphing later
    J_history = []
    p_history = []
    b = b_in
    w = w_in

    for i in range(num_iters):
        # Calculate the gradient and update the parameters using gradient_function
        dj_dw, dj_db = gradient_function(x, y, w , b)

        # Update Parameters using equation (3) above
        b = b - alpha * dj_db
        w = w - alpha * dj_dw

        # Save cost J at each iteration
        if i<100000:      # prevent resource exhaustion
            J_history.append( cost_function(x, y, w , b))
            p_history.append([w,b])
        # Print cost every at intervals 10 times or as many iterations if < 10
        if i% math.ceil(num_iters/10) == 0:
            print(f"Iteration {i:4}: Cost {J_history[-1]:0.2e} ",
                  f"dj_dw: {dj_dw: 0.3e}, dj_db: {dj_db: 0.3e}  ",
                  f"w: {w: 0.3e}, b:{b: 0.5e}")

    return w, b, J_history, p_history #return w and J,w history for graphing
※※关于α选择以及判定的 详细内容看: 2.2.3机器学习—— 判定梯度下降是否收敛 + α学习率的选择
本文来自互联网用户投稿,该文观点仅代表作者本人,不代表本站立场。本站仅提供信息存储空间服务,不拥有所有权,不承担相关法律责任。 如若内容造成侵权/违法违规/事实不符,请联系我的编程经验分享网邮箱:chenni525@qq.com进行投诉反馈,一经查实,立即删除!
](https://img-blog.csdnimg.cn/direct/c8bcf0eb4eb141909ef1434038f1ce89.png)
