记一个科研论文的细节问题
前言
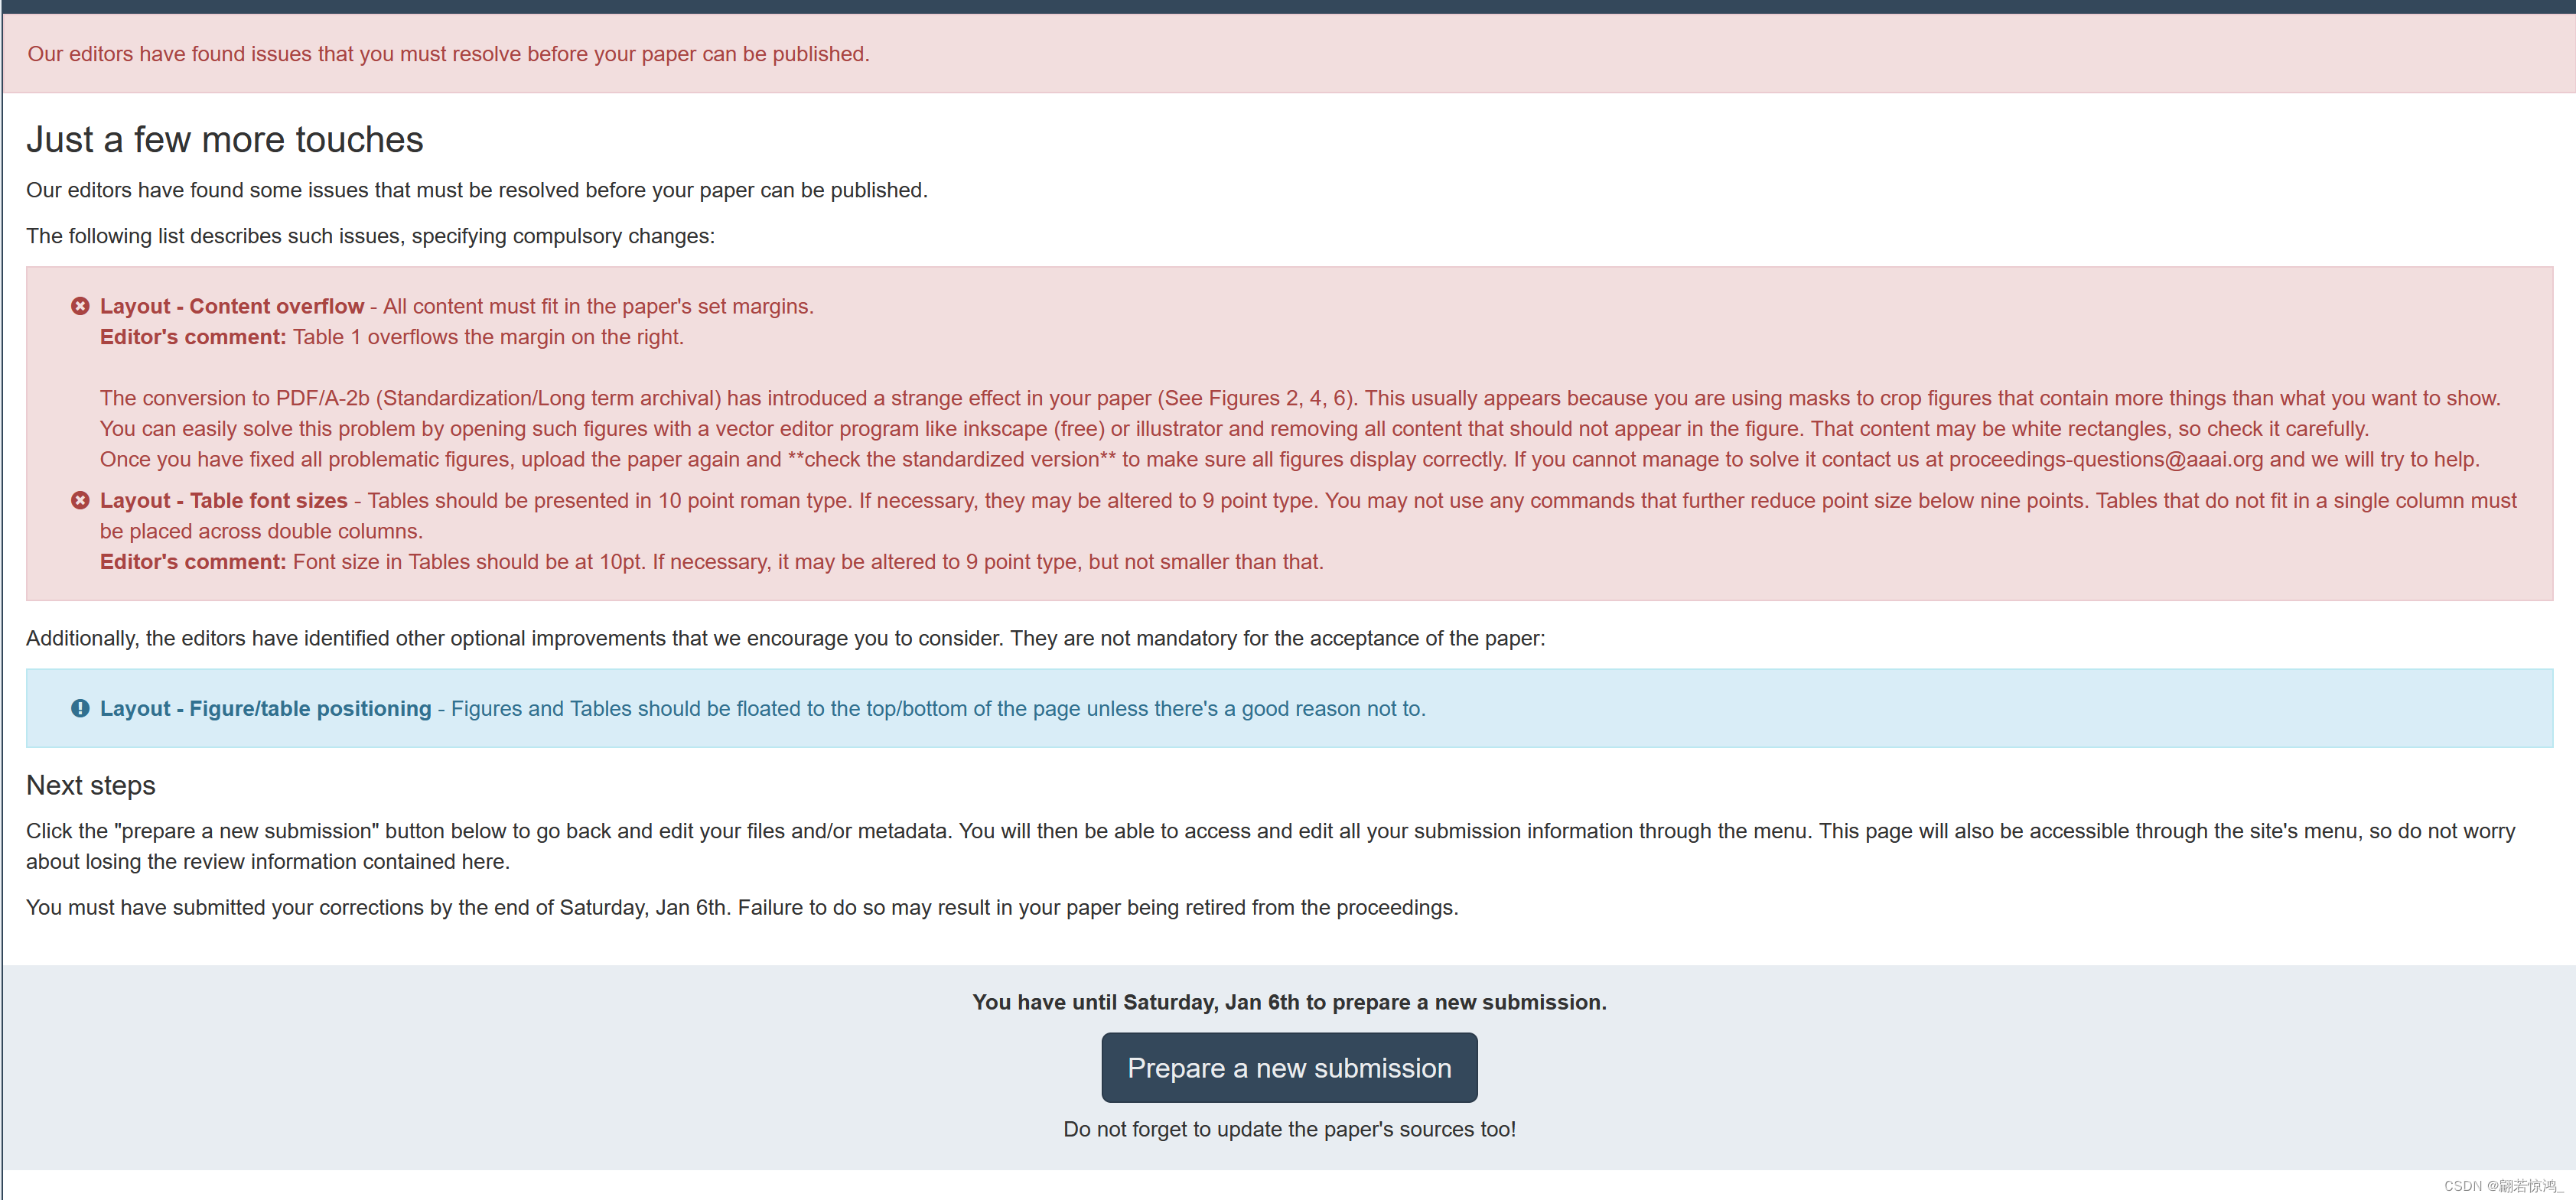
众所周知,CS的论文是要用LaTeX编辑的。一直以来我对论文里出现的图和表都有一些疑惑,正好这两天提交的camera ready版本的论文被打回了,打回的理由如下:

大意是,Paper中的Table的Font不符合要求,Figure也有问题。这正好牵扯到了我一直以来的一些疑问,所以在这里写出详细的解释和解决过程,供今后参考。
一、Table font size?
comment里写的很清楚,AAAI要求Table的Font size为10pt,最小也是9pt,那么我们的论文为什么不符合标准呢?
原因是使用了adjustbox,比如\begin{adjustbox}{width=0.48\textwidth},他的作用是把表格按照规定的宽度进行缩放,所以再大的Table也能放的下,但是Font会变得很小,如图:

所以这里只好减少表格内容,然后去掉adjustbox了。官方给出的代码是这样的:
\begin{table}[t]
	\centering
	%\resizebox{.95\columnwidth}{!}{
	\begin{tabular}{l|l|l|l}
	    authblk & babel & cjk & dvips \\
	    epsf & epsfig & euler & float \\
	    fullpage & geometry & graphics & hyperref \\
	    layout & linespread & lmodern & maltepaper \\
	    navigator & pdfcomment & pgfplots & psfig \\
	    pstricks & t1enc & titlesec & tocbind \\
	    ulem
	\end{tabular}
	\caption{LaTeX style packages that must not be used.}
	\label{table2}
\end{table}
这样编译出来的Font size是预设的10pt,而我们想缩小一号,可以使用\small,即
\begin{table}[t]
	\small
	\centering
	%\resizebox{.95\columnwidth}{!}{
	\begin{tabular}{l|l|l|l}
	    authblk & babel & cjk & dvips \\
	    epsf & epsfig & euler & float \\
	    fullpage & geometry & graphics & hyperref \\
	    layout & linespread & lmodern & maltepaper \\
	    navigator & pdfcomment & pgfplots & psfig \\
	    pstricks & t1enc & titlesec & tocbind \\
	    ulem
	\end{tabular}
	\caption{LaTeX style packages that must not be used.}
	\label{table2}
\end{table}
最终我们得到这种效果:

二、figure
1. 大问题!
官方给出的LaTeX代码是这样的:
\begin{figure}[t]
	\centering
	\includegraphics[width=0.9\columnwidth]{figure1} % Reduce the figure size so that it is slightly narrower than the column. Don't use precise values for figure width.This setup will avoid overfull boxes.
	\caption{Using the trim and clip commands produces fragile layers that can result in disasters (like this one from an actual paper) when the color space is corrected or the PDF combined with others for the final proceedings. Crop your figures properly in a graphics program -- not in LaTeX.}
	\label{fig1}
\end{figure}
严格按照官方的代码改过之后,提交后发现还有问题

系统生成的PDF/A格式的PDF打开以后会看到确实图片是有问题的:

也就是编辑所谓的white rectangle。
经过很长时间的Google和摸索,我发现,这个白边其实是因为我们之前插入的图片(PDF格式)都进行过裁剪(使用Adobe Acrobat),但其实裁剪并不会删除被裁掉的区域,而只是隐藏起来了而已(详见Adobe官方文档),在overleaf上生成的PDF没问题,但是如果用AAAI自己的系统生成可以归档的PDF/A类型,就把原本裁剪(隐藏)掉的区域又露出来了。(至于怎么看到底被裁剪的区域到底是被隐藏了还是被删除了,进入Adobe Acrobat软件后,点击工具,找到印刷制作,点击设置页面框,如果可以看到蓝框框之外还有区域,说明没删掉,只是被隐藏了)

所以,这些区域必须删除而不是隐藏!
但是,我试了很久很久,也没法用Adobe Acrobat把隐藏的部分删掉,跟它斗智斗勇了一下午,最终以失败告终。(文档里说的删除白边距屁用没有!)
所以只好另外找办法。终于,功夫不负有心人。
2. 对LaTeX编译论文中图片的全部理解
首先,我们要思考一个问题,LaTeX中插入的图片应当是什么格式最好?必须是无损的这是毋庸置疑的,在无损之中,首推PDF格式,因为官方给的例子就是PDF格式的。
那么,我们导出的图片,不管是PPT画的图,还是Python画的图,最终一定要PDF格式。而且这个格式的还没法裁剪,因为上面所说的问题,只会隐藏不会删除,在生成可归档的PDF格式(PDF/A)时会出问题。
那么我们只好从生成这个PDF图片的时候就给它弄好,不需要后期加工的那种。
3. PPT作图
为了不产生额外的白边,我们要将整个图填满PPT的一页,这样导出来PDF才不会又白边。但是我们的图的长宽比一般不会是16:9或者4:3这种,那该怎么办呢?
大山不会走向穆罕默德,但是穆罕默德会走向大山。
我们可以改变PPT的母版的大小,而不是把我们自己的PPT组件硬拉成PPT底板那么大。如图:

改变长宽和我们自己的图一样,这时候再导出就不会出现多余的白边了。
4. Python作图
使用plt.tight_layout(pad=0.2),放出下面两段代码,仅仅差这一句话,会有很大的不同:
from sklearn.manifold import TSNE
import matplotlib.pyplot as plt
import numpy as np

plt.rcParams['font.size'] = 12
h, label = {}, {}
# path = 'h_trajectory'
# path = 'concat_embedding'
# path = 'concat_embedding_trajectory'
path = 'period_h'
# path = 'period_h_trajectory'
colors = ['#6c7197', '#d92405', '#3563eb', '#bf55ec', '#fbbf45', '#67f2d1']
# colors = plt.cm.jet(np.linspace(0, 1, 2000))
for user in range(10):
    h[user] = np.load(rf'./{path}/{user}_h2.npy')
    label[user] = np.load(rf'./{path}/{user}_category.npy')
    print(len(h[user]), len(label[user]))

for user in range(10):
    X_tsne = TSNE(n_components=2, random_state=33).fit_transform(h[user])
    color_label = []
    for i in range(len(label[user])):
        color_label.append(colors[label[user][i] - 1])
    plt.figure(figsize=(6, 6))

    for category in range(6):
        cluster_indices = np.where(label[user] == (category + 1))
        plt.scatter(X_tsne[cluster_indices, 0], X_tsne[cluster_indices, 1], c=colors[category],
                    label=rf"{4 * category}:00 - {4 * (category + 1)}:00")

    plt.xticks([])
    plt.yticks([])

    lg = plt.legend(loc='upper right')
    lg.set_title(title="time slot", prop={'family': 'Times New Roman', 'size': 16})

    plt.savefig(rf'./{path}/user_{user}.pdf')
    plt.show()
from sklearn.manifold import TSNE
import matplotlib.pyplot as plt
import numpy as np

plt.rcParams['font.size'] = 12
h, label = {}, {}
# path = 'h_trajectory'
# path = 'concat_embedding'
# path = 'concat_embedding_trajectory'
path = 'period_h'
# path = 'period_h_trajectory'
colors = ['#6c7197', '#d92405', '#3563eb', '#bf55ec', '#fbbf45', '#67f2d1']
# colors = plt.cm.jet(np.linspace(0, 1, 2000))
for user in range(10):
    h[user] = np.load(rf'./{path}/{user}_h2.npy')
    label[user] = np.load(rf'./{path}/{user}_category.npy')
    print(len(h[user]), len(label[user]))

for user in range(10):
    X_tsne = TSNE(n_components=2, random_state=33).fit_transform(h[user])
    color_label = []
    for i in range(len(label[user])):
        color_label.append(colors[label[user][i] - 1])
    plt.figure(figsize=(6, 6))

    for category in range(6):
        cluster_indices = np.where(label[user] == (category + 1))
        plt.scatter(X_tsne[cluster_indices, 0], X_tsne[cluster_indices, 1], c=colors[category],
                    label=rf"{4 * category}:00 - {4 * (category + 1)}:00")

    plt.xticks([])
    plt.yticks([])

    lg = plt.legend(loc='upper right')
    lg.set_title(title="time slot", prop={'family': 'Times New Roman', 'size': 16})

    plt.tight_layout(pad=0.2)

    plt.savefig(rf'./{path}/user_{user}.pdf')
    plt.show()
三、总结
总算是把这个问题彻底解决了,呼~
本文来自互联网用户投稿,该文观点仅代表作者本人,不代表本站立场。本站仅提供信息存储空间服务,不拥有所有权,不承担相关法律责任。 如若内容造成侵权/违法违规/事实不符,请联系我的编程经验分享网邮箱:chenni525@qq.com进行投诉反馈,一经查实,立即删除!