vue-amap区域显示,3d棱柱效果
发布时间:2024年01月04日
vue-amap中文文档: https://www.wenjiangs.com/doc/mdxkhhtr
一、在vue项目中安装和基本使用
1. 安装
npm install vue-amap --save
2. 在vue项目中使用
1. 在main.js中引入
import VueAMap from 'vue-amap';

Vue.use(VueAMap);
VueAMap.initAMapApiLoader({
  key: "你的key",
  plugin: [
    "AMap.Scale",
    "AMap.OverView",
    "AMap.ToolBar",
    "AMap.MapType",
    "AMap.DistrictSearch",
  ],
  v: "1.4.4",
});
window._AMapSecurityConfig = {
  securityJsCode: "你的安全密钥",
};
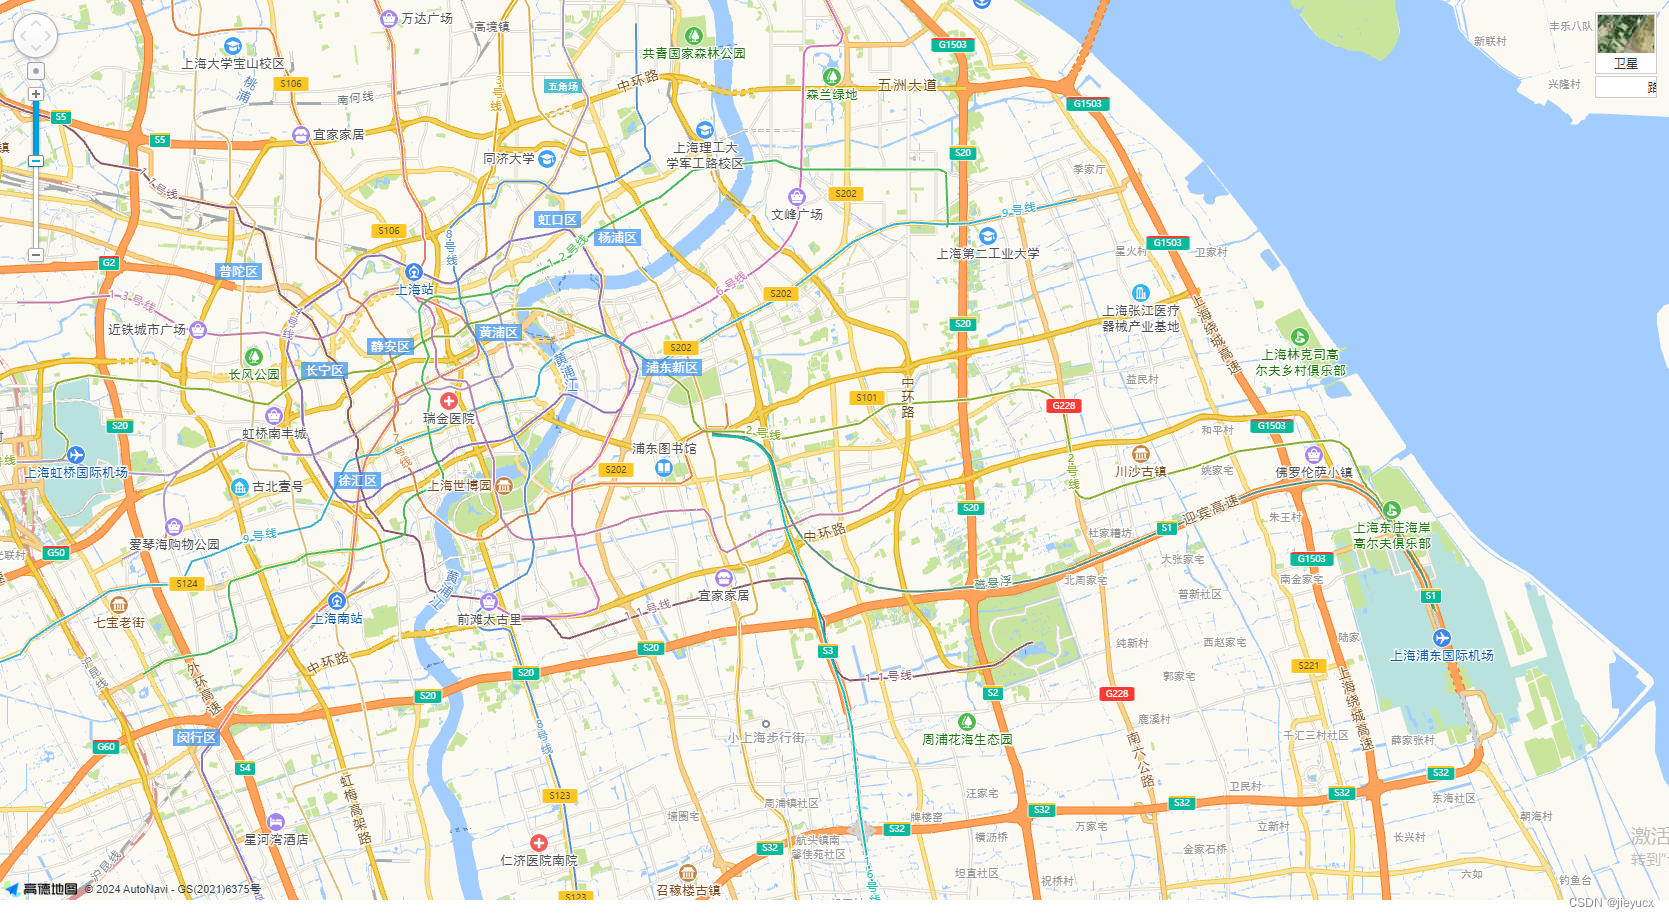
2. demo显示高德地图
<template>
  <div>
    <div class="amap-page-container">
      <el-amap
        ref="map"
        vid="amapDemo"
        :center="center"
        :zoom="zoom"
        :plugin="plugin"
        :events="events"
        class="amap-demo"
      >
      </el-amap>
    </div>
  </div>
</template>

<script>
export default {
  data() {
    return {
      zoom: 12,
      center: [121.59996, 31.197646],
      events: {
        init: (o) => {
          console.log(o.getCenter());
          console.log(this.$refs.map.$$getInstance());
          o.getCity((result) => {
            console.log(result);
          });
        },
        moveend: () => {},
        zoomchange: () => {},
        click: (e) => {
          alert("map clicked");
        },
      },
      plugin: [
        "ToolBar",
        {
          pName: "MapType",
          defaultType: 0,
          events: {
            init(o) {
              console.log(o);
            },
          },
        },
      ],
    };
  },
};
</script>

<style lang="less" scoped>
.amap-page-container {
  width: 100%;
  height: 900px;
  position: relative;

  .amap-demo {
    width: 100%;
    height: 100%;
  }
}
</style>
效果如图:
二、显示区域
效果如图:
代码如下:
<template>
  <div>
    <div class="amap-page-container">
      <el-amap
        ref="map"
        vid="amapDemo"
        :center="center"
        :zoom="zoom"
        :plugin="plugin"
        :events="events"
        class="amap-demo"
      >
      </el-amap>
    </div>
  </div>
</template>

<script>
export default {
  data() {
    return {
      zoom: 12,
      center: [121.59996, 31.197646],
      events: {
        init: this.initMap,
        moveend: () => {},
        zoomchange: () => {},
        click: (e) => {
          alert("map clicked");
        },
      },
      plugin: [
        "ToolBar",
        {
          pName: "MapType",
          defaultType: 0,
          events: {
            init(o) {
              console.log(o);
            },
          },
        },
      ],
    };
  },
  methods: {
    initMap(map) {
        setTimeout(() => {
            this.drawBounds(map)
        }, 200)
    },
     drawBounds(map) {
            let opts = {
                subdistrict: 0,
                extensions: 'all',
                level: 'city'
            }
            let district = new AMap.DistrictSearch(opts)
            let polygons = []
            district.setLevel('上海市')
            district.search("上海市", (status, result) => {
                map.remove(polygons)
                polygons = [];
                let bounds = result.districtList[0].boundaries;
                if (bounds) {
                    for (let i = 0, l = bounds.length; i < l; i++) {
                        let polygon = new AMap.Polygon({
                            strokeWeight: 3,
                            path: bounds[i],
                            fillOpacity: 0.4,
                            fillColor: '#111e4b',
                            strokeColor: '#ffffff',
                            height: 100,
                            extrusionHeight: 100
                        });
                        polygons.push(polygon);
                    }
                }
                map.add(polygons)
                map.setFitView(polygons);
            })
        },
  }
};
</script>

<style lang="less" scoped>
.amap-page-container {
  width: 100%;
  height: 900px;
  position: relative;

  .amap-demo {
    width: 100%;
    height: 100%;
  }
}
</style>
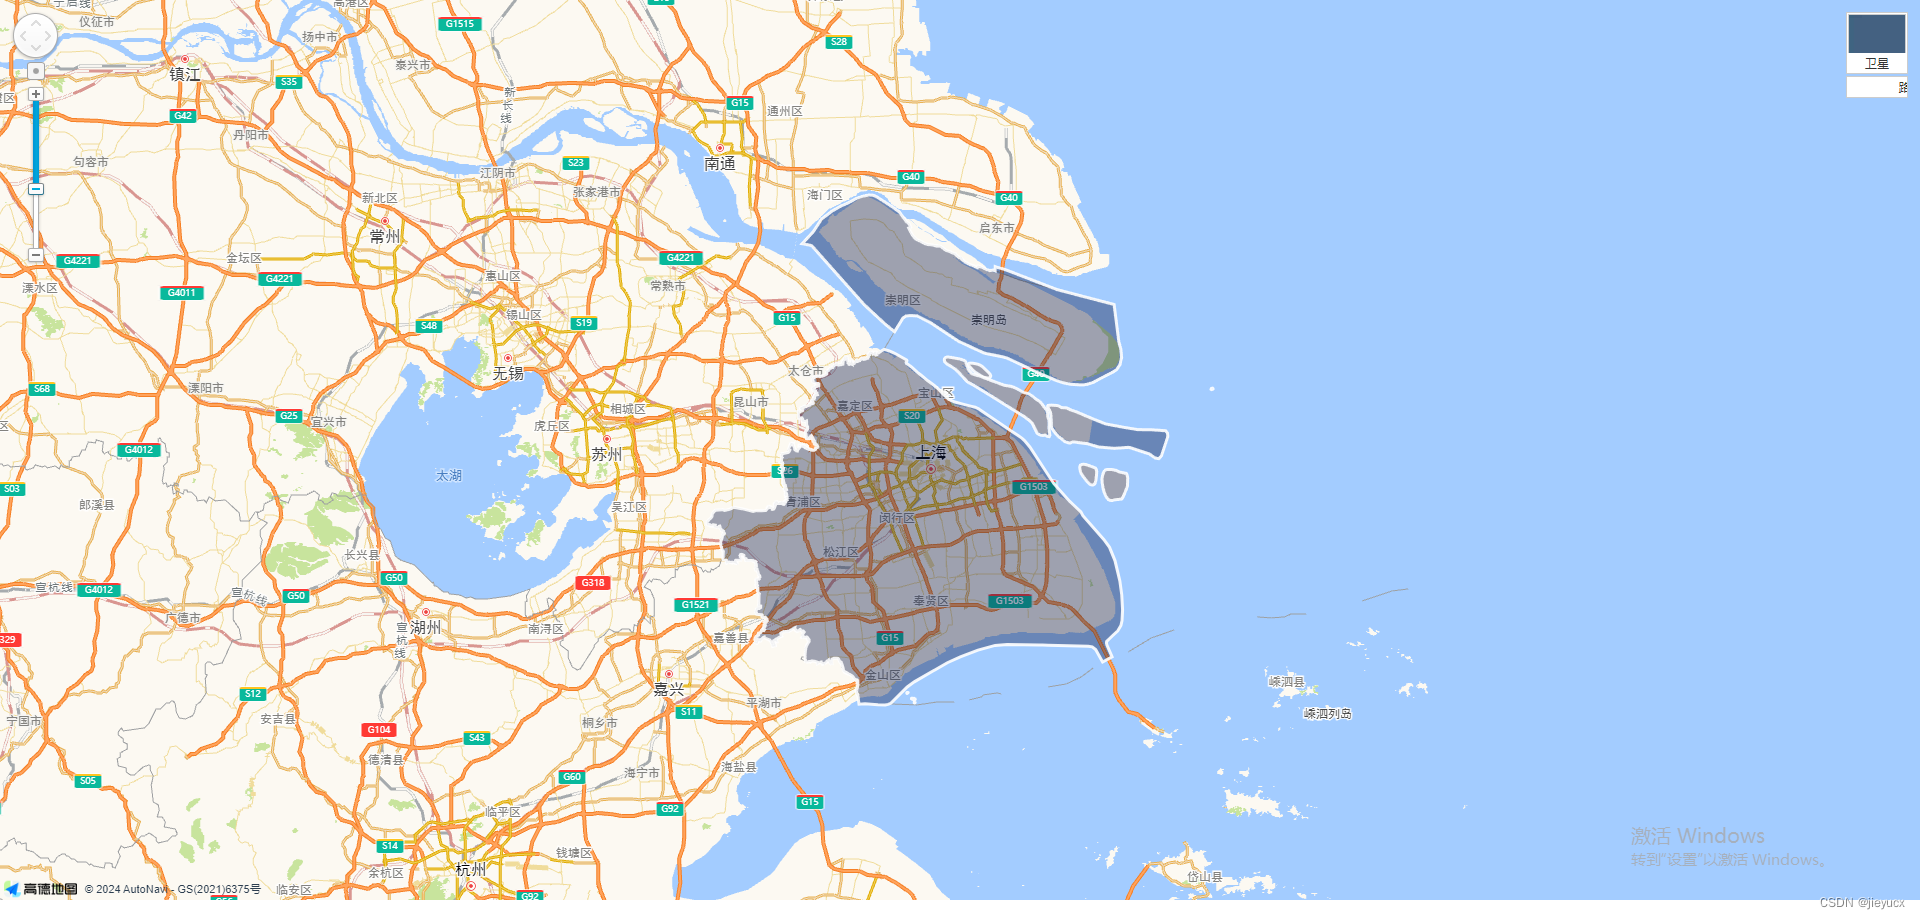
三、只显示某个区域
效果如图:
代码如下:
<template>
  <div>
    <div class="amap-page-container">
      <el-amap
        ref="map"
        vid="amapDemo"
        :center="center"
        :zoom="zoom"
        :plugin="plugin"
        :events="events"
        class="amap-demo"
      >
      </el-amap>
    </div>
  </div>
</template>

<script>
export default {
  data() {
    return {
      zoom: 12,
      center: [121.59996, 31.197646],
      events: {
        init: this.initMap,
        moveend: () => {},
        zoomchange: () => {},
        click: (e) => {
          alert("map clicked");
        },
      },
      plugin: [
        "ToolBar",
        {
          pName: "MapType",
          defaultType: 0,
          events: {
            init(o) {
              console.log(o);
            },
          },
        },
      ],
    };
  },
  methods: {
    initMap(map) {
        setTimeout(() => {
            this.drawBounds(map)
        }, 200)
    },
     drawBounds(map) {
            let opts = {
                subdistrict: 0,
                extensions: 'all',
                level: 'city'
            }
            let district = new AMap.DistrictSearch(opts)
            let polygons = []
            district.setLevel('上海市')
            district.search("上海市", (status, result) => {
                map.remove(polygons)
                polygons = [];
                let bounds = result.districtList[0].boundaries;

                if (bounds) {
                    for (let i = 0, l = bounds.length; i < l; i++) {
                        let polygon = new AMap.Polygon({
                            strokeWeight: 3,
                            path: bounds[i],
                            fillOpacity: 0.4,
                            fillColor: '#ffffff',
                            strokeColor: '#ffffff',
                        });
                        polygons.push(polygon);
                    }
                }
                map.add(polygons)
                map.setFitView(polygons);

                let outer = [
                    new AMap.LngLat(-360, 90, true),
                    new AMap.LngLat(-360, -90, true),
                    new AMap.LngLat(360, -90, true),
                    new AMap.LngLat(360, 90, true),
                ]
                let holes = result.districtList[0].boundaries
                console.log('holes', holes)
                let pathArray = [
                    outer
                ]
                pathArray.push.apply(pathArray, holes)
                let polygon = new AMap.Polygon({
                    pathL: pathArray,
                    strokeColor: "#ffffff",
                    strokeWeight: 3,
                    strokeOpacity: 1,
                    fillColor: '#031f52',
                    fillOpacity: 1,
                });
                polygon.setPath(pathArray)
                map.add(polygon)
            })
        },
  }
};
</script>

<style lang="less" scoped>
.amap-page-container {
  width: 100%;
  height: 900px;
  position: relative;

  .amap-demo {
    width: 100%;
    height: 100%;
  }
}
</style>
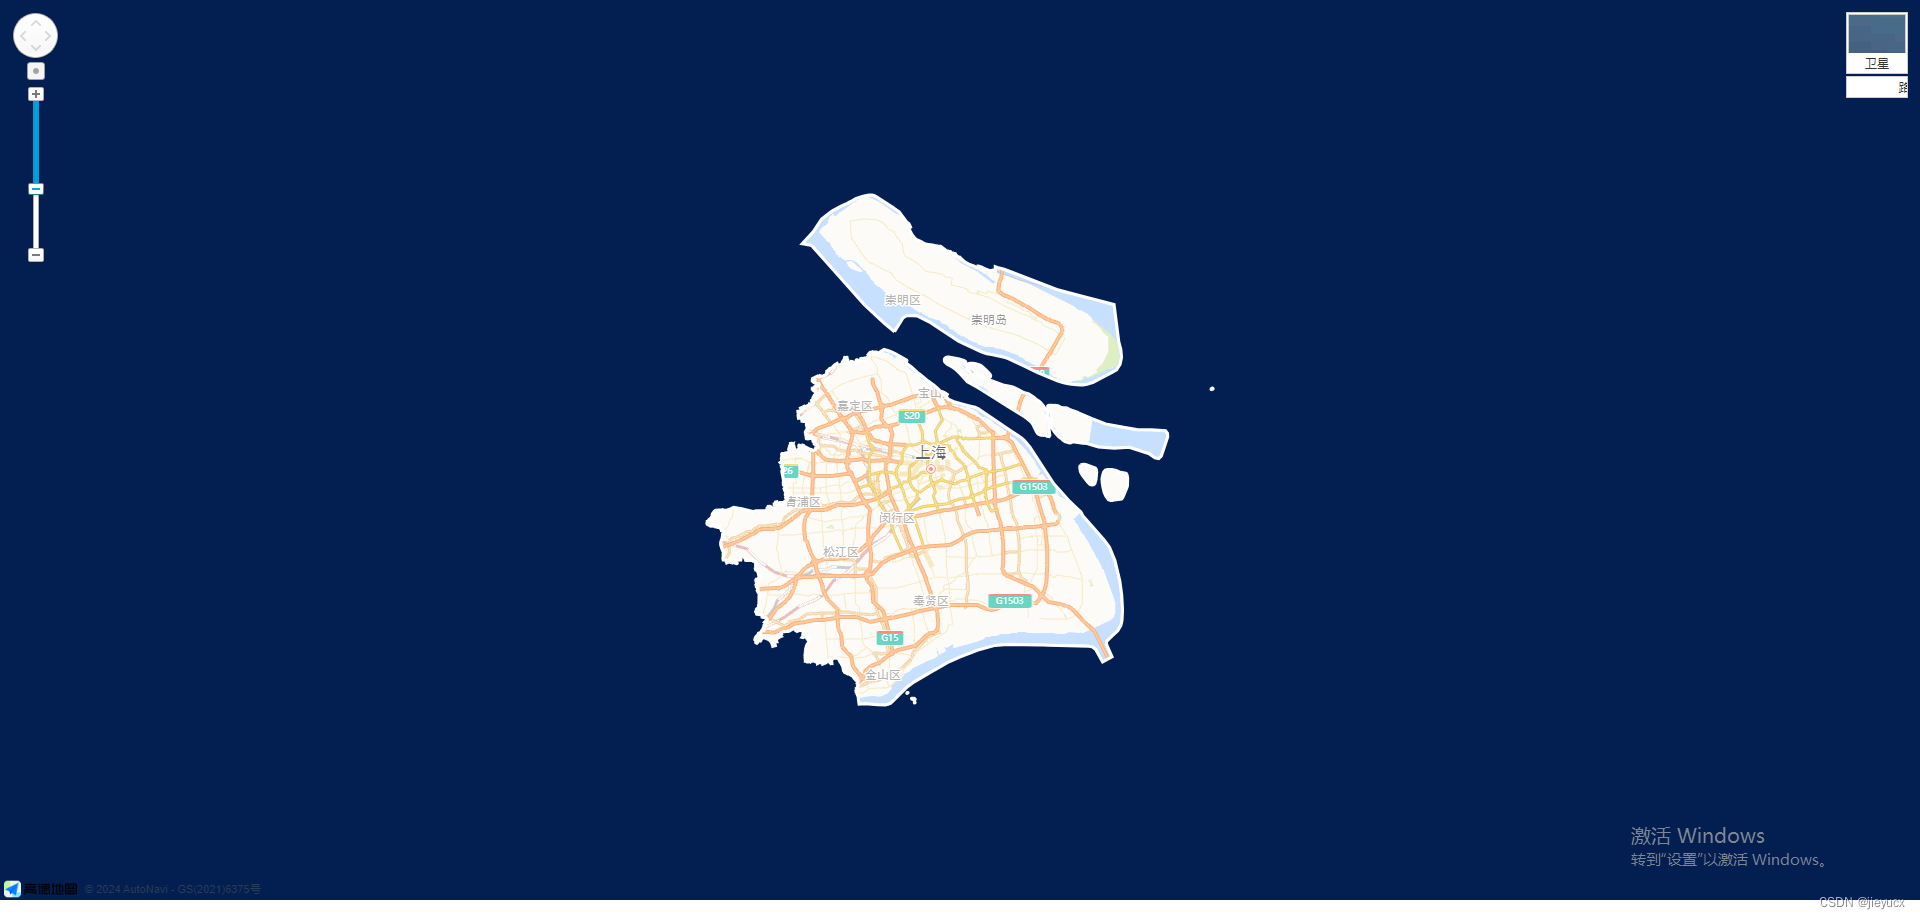
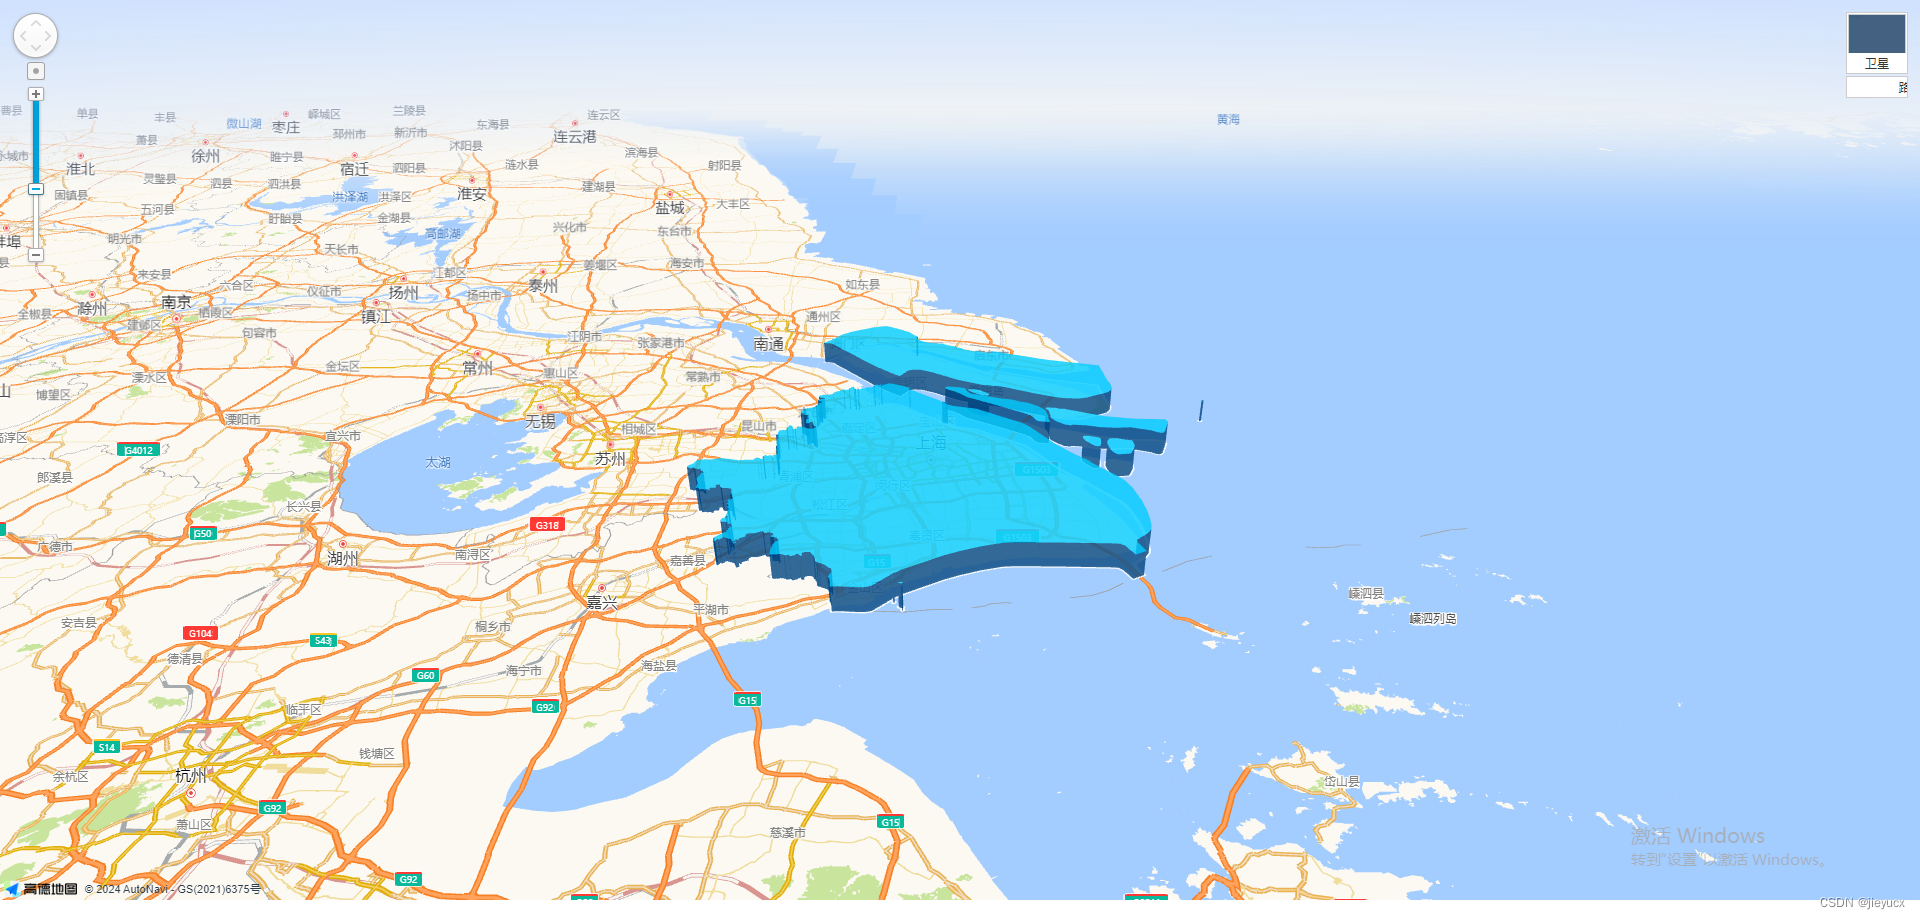
四、3D棱柱区域
效果如图:
代码如下:
<template>
  <div>
    <div class="amap-page-container">
      <el-amap
        ref="map"
        vid="amapDemo"
        :center="center"
        :zoom="zoom"
        :plugin="plugin"
        :events="events"
        :pitch="pitch"
        viewMode="3D"
        class="amap-demo"
      >
      </el-amap>
    </div>
  </div>
</template>

<script>
export default {
  data() {
    return {
      pitch: 60,
      zoom: 12,
      center: [121.59996, 31.197646],
      events: {
        init: this.initMap,
        moveend: () => {},
        zoomchange: () => {},
        click: (e) => {
          alert("map clicked");
        },
      },
      plugin: [
        "ToolBar",
        {
          pName: "MapType",
          defaultType: 0,
          events: {
            init(o) {
              console.log(o);
            },
          },
        },
      ],
    };
  },
  methods: {
    initMap(map) {
      setTimeout(() => {
        this.drawBounds(map);
      }, 200);
    },
    drawBounds(map) {
      map.AmbientLight = new AMap.Lights.AmbientLight([1, 1, 1], 0.5);
      map.DirectionLight = new AMap.Lights.DirectionLight(
        [0, 0, 1],
        [1, 1, 1],
        1
      );
      let object3Dlayer = new AMap.Object3DLayer();
      map.add(object3Dlayer);

      let opts = {
        subdistrict: 0,
        extensions: "all",
        level: "city",
      };
      let district = new AMap.DistrictSearch(opts);
      let polygons = [];
      district.setLevel("上海市");
      district.search("上海市", (status, result) => {
        map.remove(polygons);
        polygons = [];
        let bounds = result.districtList[0].boundaries;

        let height = 50000;
        let color = "#0088ffcc"; // #0088ffcc; #111e4bcc
        let prism = new AMap.Object3D.Prism({
          path: bounds,
          height: height,
          color: color,
        });
        prism.transparent = true;
        object3Dlayer.add(prism);

        if (bounds) {
          for (let i = 0, l = bounds.length; i < l; i++) {
            let polygon = new AMap.Polygon({
              strokeWeight: 3,
              path: bounds[i],
              fillOpacity: 0.4,
              fillColor: "#ffffff",
              strokeColor: "#ffffff",
            });
            polygons.push(polygon);
          }
        }
        map.add(polygons);
        map.setFitView(polygons);


      });
    },
  },
};
</script>

<style lang="less" scoped>
.amap-page-container {
  width: 100%;
  height: 900px;
  position: relative;

  .amap-demo {
    width: 100%;
    height: 100%;
  }
}
</style>
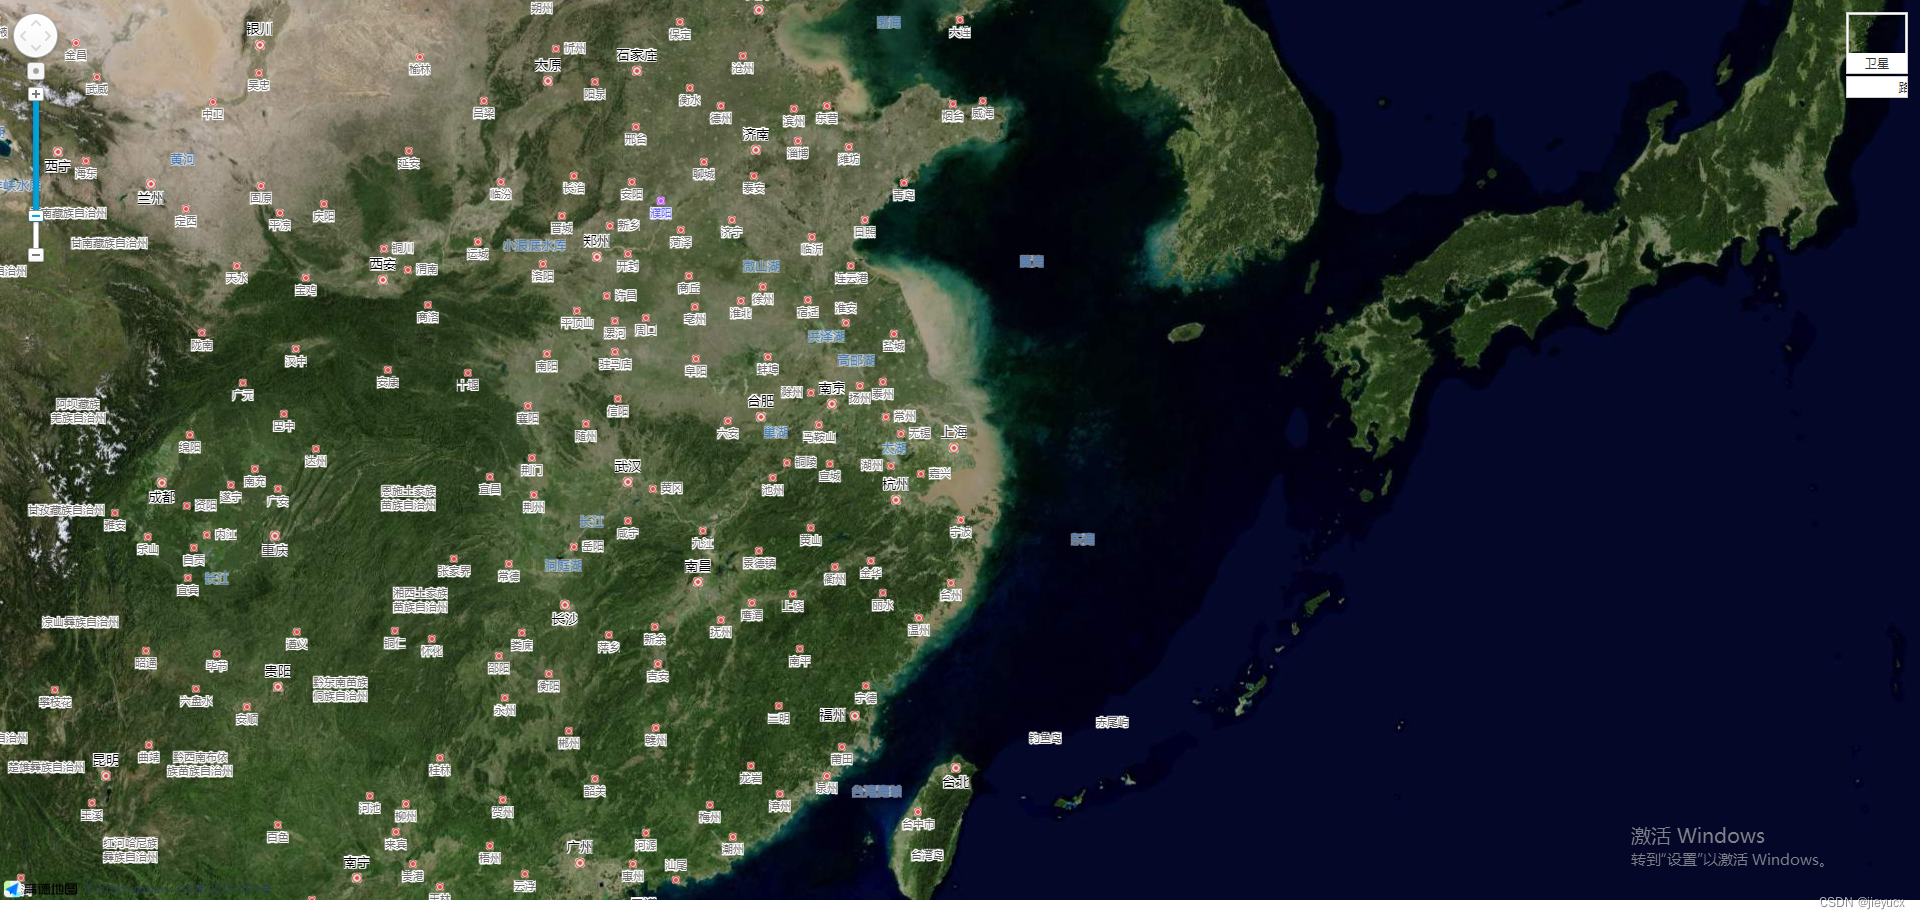
五、添加卫星图层
效果如图:
代码如下:
<template>
  <div>
    <div class="amap-page-container">
      <el-amap
        ref="map"
        vid="amapDemo"
        :center="center"
        :zoom="zoom"
        :plugin="plugin"
        :events="events"
        :pitch="pitch"
        viewMode="3D"
        class="amap-demo"
      >
      </el-amap>
    </div>
  </div>
</template>

<script>
export default {
  data() {
    return {
      pitch: 0,
      zoom: 6,
      center: [121.59996, 31.197646],
      events: {
        init: this.initMap,
        moveend: () => {},
        zoomchange: () => {},
        click: (e) => {
          alert("map clicked");
        },
      },
      plugin: [
        "ToolBar",
        {
          pName: "MapType",
          defaultType: 0,
          events: {
            init(o) {
              console.log(o);
            },
          },
        },
      ],
    };
  },
  methods: {
    initMap(map) {
      setTimeout(() => {
        this.setSatelliteLayer();
      }, 200);
    },
    setSatelliteLayer() {
      const tileLayer = new AMap.TileLayer.Satellite({
        map: this.$refs.map.$$getInstance(),
      });
      tileLayer.show();
    },
  },
};
</script>

<style lang="less" scoped>
.amap-page-container {
  width: 100%;
  height: 900px;
  position: relative;

  .amap-demo {
    width: 100%;
    height: 100%;
  }
}
</style>
文章来源:https://blog.csdn.net/jieyucx/article/details/135377325
本文来自互联网用户投稿,该文观点仅代表作者本人,不代表本站立场。本站仅提供信息存储空间服务,不拥有所有权,不承担相关法律责任。 如若内容造成侵权/违法违规/事实不符,请联系我的编程经验分享网邮箱:chenni525@qq.com进行投诉反馈,一经查实,立即删除!
本文来自互联网用户投稿,该文观点仅代表作者本人,不代表本站立场。本站仅提供信息存储空间服务,不拥有所有权,不承担相关法律责任。 如若内容造成侵权/违法违规/事实不符,请联系我的编程经验分享网邮箱:chenni525@qq.com进行投诉反馈,一经查实,立即删除!
最新文章
- Python教程
- 深入理解 MySQL 中的 HAVING 关键字和聚合函数
- Qt之QChar编码(1)
- MyBatis入门基础篇
- 用Python脚本实现FFmpeg批量转换
- 2024年软件测试面试八股文【含答案】
- C++11 =default,=delete
- OpenCV-Python(47):支持向量机
- np.where多个筛选条件
- 使用netdxf(C#)框架实现dxf文件读取与导出坐标
- vc 用MySQL Connector/C++
- 企业电子招投标系统源码之电子招投标系统建设的重点和未来趋势
- 使用Python操纵Word自动编写离职报告
- 解决Typora笔记上传到CSDN上图片无法显示的问题
- 查找局域网树莓派raspberry的mac地址和ip