echarts的markLine 图表标线使用
发布时间:2024年01月18日
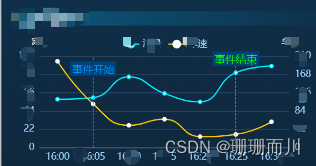
预期效果

官方介绍
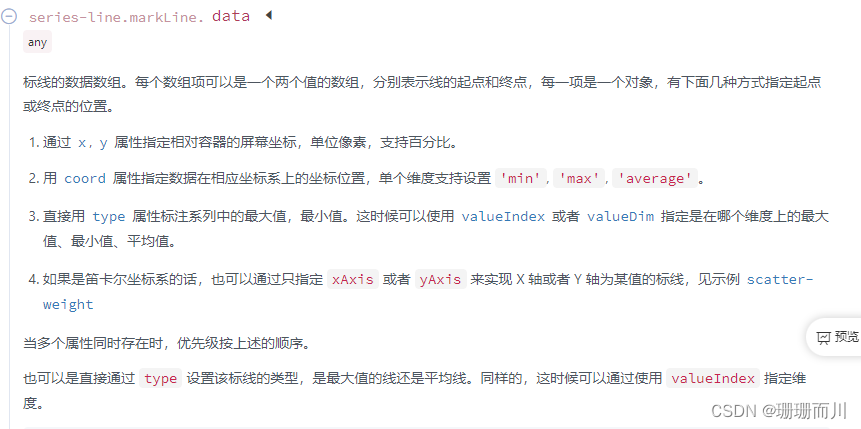
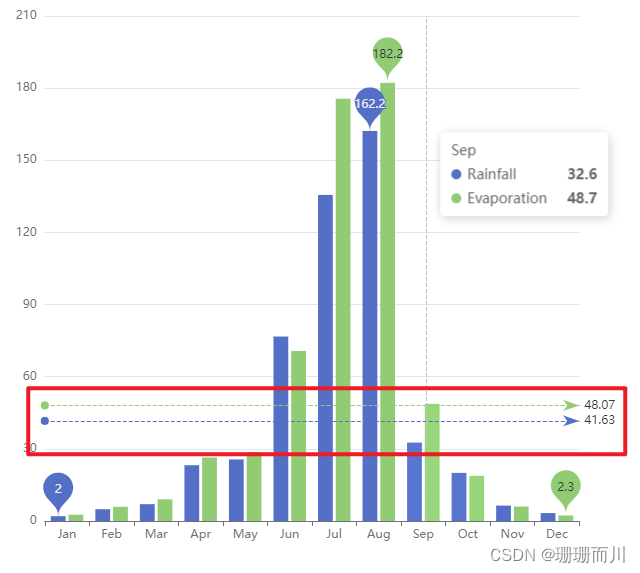
案例1
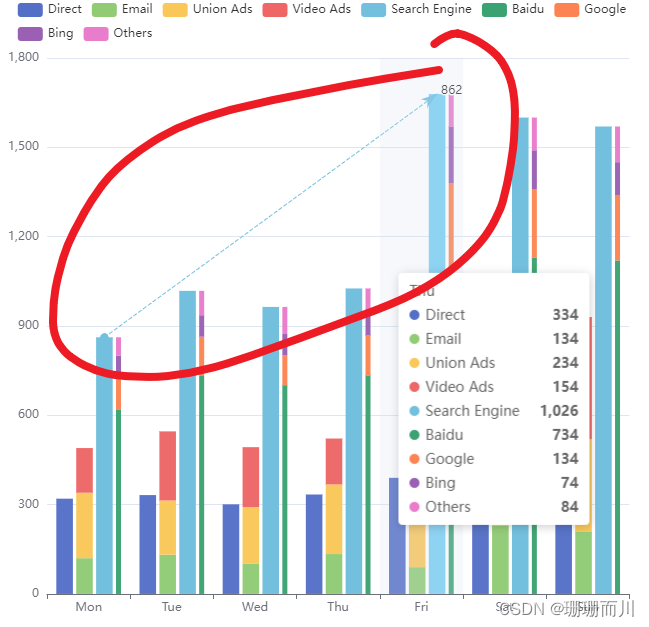
案例2
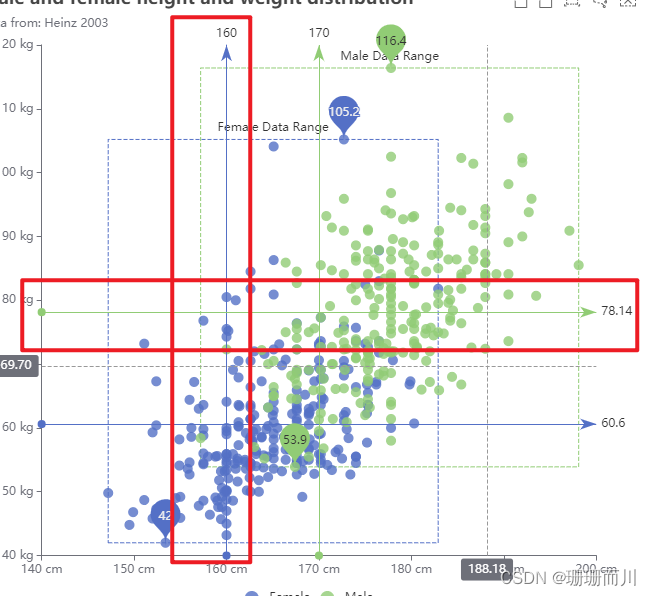
案例3
样式调整
去掉上面的箭头
 markLine: {
          symbol: 'none', //去掉上面的箭头
          lineStyle: {
            type: 'dashed'
          },
去掉下面的圆点
markLine: {
          symbol: 'none',
          lineStyle: {
            type: 'dashed'
          },
          data: [
            {
              name: 'X 轴值为 100 的竖直线',
              xAxis: '16:05',
              symbol: 'none',  // 去掉下面的圆点
文字标签“事件开始”
markLine: {
          symbol: 'none',
          lineStyle: {
            type: 'dashed'
          },
          data: [
            {
              name: 'X 轴值为 100 的竖直线',
              xAxis: '16:05',
              symbol: 'none',
              label: {  // 文字标签
                // show: false
                formatter: '事件开始',
                fontSize: '16px',
                fontFamily: 'Alibaba-PuHuiTi',
                backgroundColor: '#004277',
                color: '#0091FF',
                // position: 'middle',
                distance: [10, -30], // 设置标签文字的样式
                width: 70,
                height: 22
              }
实现结果
完整代码
 const option = {
    grid: {
      top: '30px',
      bottom: '10px',
      left: '10px',
      right: '10px',
      containLabel: true
    },
    tooltip: {
      trigger: 'axis'
    },
    legend: {
      //   top: '20',
      right: 'center',
      data: ['流量', '车速'],
      textStyle: {
        color: '#9DD7FF',
        fontSize: 14
      }
    },
    xAxis: {
      type: 'category',
      boundaryGap: true, // 坐标轴两边留白
      data: ['16:00', '16:05', '16:10', '16:15', '16:20', '16:25', '16:30'],
      axisLabel: {
        interval: 0,
        //	margin:15,
        textStyle: {
          color: '#9DD7FF',
          fontSize: 14
        }
      },

      axisTick: {
        show: false
      }
    },
    yAxis: [
      {
        name: '流量',
        type: 'value',
        min: 0, // 最小值
        max: max_Y1.value, // 最大值
        position: 'left',
        splitNumber: 5,
        interval: max_Y1.value / 5, // 强制设置坐标轴分割间隔度(取本Y轴的最大值 max / 分割段数 splitNumber )
        axisLabel: {
          textStyle: {
            color: '#9DD7FF',
            fontSize: 14
          }
        },
        splitLine: {
          show: true,
          lineStyle: {
            color: '#2E4867'
            // type: 'dashed'
          }
        },
        axisLine: {
          show: false,
          lineStyle: {
            color: '#FFF'
          }
        },
        axisTick: {
          show: false
        }
      },
      {
        name: '车速',
        type: 'value',
        position: 'right',
        splitNumber: 5,
        min: 0, // 最小值
        max: max_Y2.value, // 最大值
        interval: max_Y2.value / 5, // 强制设置坐标轴分割间隔度(取本Y轴的最大值 max / 分割段数 splitNumber )

        axisLabel: {
          show: true,
          textStyle: {
            color: '#9DD7FF',
            fontSize: 14
          }
        },
        splitLine: {
          show: true,
          lineStyle: {
            color: '#2E4867',
            type: 'dashed'
          }
        },
        axisLine: {
          lineStyle: {
            color: '#FFFFFF'
          }
        },
        axisTick: {
          show: false
        }
      }
    ],
    series: [
      {
        name: '流量',
        type: 'line',
        smooth: true,
        yAxisIndex: 0,
        symbolSize: 5,
        markLine: {
          symbol: 'none', // 去掉上面的箭头

          data: [
            {
              xAxis: '16:05',
              symbol: 'none', // 去掉下面的圆点
              lineStyle: {
                type: 'dashed',
                color: '#0091FF'
              },
              label: {
                // show: false
                formatter: '事件开始',
                fontSize: '16px',
                fontFamily: 'Alibaba-PuHuiTi',
                backgroundColor: '#004277',
                color: '#0091FF',
                // position: 'middle',
                distance: [10, -30], // 设置标签文字的样式
                width: 70,
                height: 22
              }
            },
            {
              xAxis: '16:25',
              symbol: 'none', // 去掉下面的圆点
              label: {
                // show: false
                lineStyle: {
                  type: 'dashed',
                  color: '#00FF03'
                },
                formatter: '事件结束',
                fontSize: '16px',
                fontFamily: 'Alibaba-PuHuiTi',
                backgroundColor: '#004277',
                color: '#00FF03',
                // position: 'middle',
                distance: [10, -15], // 设置标签文字的样式
                width: 70,
                height: 22
              }
            }
          ]
        },
        itemStyle: {
          normal: {
            color: '#00ECFC',
            lineStyle: {
              color: '#00ECFC',
              width: 2
            }
          }
        },
        data: state.flowList
      },
      {
        name: '车速',
        type: 'line',
        smooth: true,
        yAxisIndex: 1,
        symbolSize: 5,
        itemStyle: {
          normal: {
            color: '#fff',
            lineStyle: {
              color: '#FFC900',
              width: 2
            }
          }
        },

        axisLabel: {
          show: true,
          textStyle: {
            color: '#fff'
          }
          //   formatter: function (value) {
          //     return value + '%'
          //   }
        },
        data: state.speedList
      }
    ]
  }
文章来源:https://blog.csdn.net/weixin_63681863/article/details/135653591
本文来自互联网用户投稿,该文观点仅代表作者本人,不代表本站立场。本站仅提供信息存储空间服务,不拥有所有权,不承担相关法律责任。 如若内容造成侵权/违法违规/事实不符,请联系我的编程经验分享网邮箱:chenni525@qq.com进行投诉反馈,一经查实,立即删除!
本文来自互联网用户投稿,该文观点仅代表作者本人,不代表本站立场。本站仅提供信息存储空间服务,不拥有所有权,不承担相关法律责任。 如若内容造成侵权/违法违规/事实不符,请联系我的编程经验分享网邮箱:chenni525@qq.com进行投诉反馈,一经查实,立即删除!
最新文章
- Python教程
- 深入理解 MySQL 中的 HAVING 关键字和聚合函数
- Qt之QChar编码(1)
- MyBatis入门基础篇
- 用Python脚本实现FFmpeg批量转换
- 安装阿里云CLI之配置阿里云凭证信息
- 2024年【制冷与空调设备运行操作】考试及制冷与空调设备运行操作免费试题
- centos安装docker-compose
- JAVA基础---抽象类和接口
- 入门Python笔记详细介绍
- 【网络奇遇记】揭秘计算机网络的性能指标:速率|带宽|吞吐量|时延
- kubernetes -pod 实践
- 计算机网络【DHCP动态主机配置协议】
- WORDPRESS付费会员插件Paid Memberships Pro v2.12.5 – Plugin + All Addons
- JAVA那些事(六)类的继承和多态机制