决策树深度探索: 从基础构建到机器学习应用
机器学习 第六课 决策树
概述
决策树 (Decision Tree) 是一种基本的分类与回归方法, 是很多进阶机器学习算法的基石. 决策树以树的结构来模型化学决策过程, 每个节点表示一个属性上的测试, 每个分支比哦啊还是测试的结果, 最终的每个叶节点代表决定的分类. 决策树直观, 易于理解, 是数据挖掘和机器学习 (Machine Learning) 的常用工具. 今天小白我来带大家了解一下决策树的强大功能和广泛应用领域.

决策树的基本概念
决策树 (Decision Tree) 是基于数结构进行决策, 基本思想来源于人类的决策过程. 举个例子, 当我们购买手机时, 会先考虑价格是否在预算范围内, 然后再考虑品牌, 性能, 外观等因素. 决策树就是通过类似的逻辑过程, 自顶向下进行决策. 树 (Tree) 的每个节点都包含了一个条件判断, 根据不同的条件, 数据分到不同的子节点 (Child Node) 去, 如此循环直至到达叶节点 (Leaf Node), 得到最终的分类结果.

决策树的重要性主要体现在直观性和易解释性上. 与神经网络 (Neural Network) 或支持向量机 (SVM, Support Vector Machine) 等算法相比, 决策树更容易理解, 对于医学, 金融, 商业等领域, 非常重要. 因为这些领域不仅要准确的结果, 还需要证明结果是如何得到的.
决策树的应用
决策树 (Decision Tree) 用于分类问题:
- 风险评估, 通过收入, 负债, 年龄, 职业, 教育等, 来预测借款人的违约风险
- 垃圾邮件检测, 通过邮件的内容, 发件人, 发送频率等, 来预测邮件是否为垃圾邮件
- 用户流失预测, 通过分析购买历史, 服务使用情况, 满意度调查等数据来预测客户是否可能在未来流失
决策树 (Decision Tree) 用于回归问题:
- 房价预测, 通过分析房屋特征, 如面积, 地段, 年龄等, 决策树可以帮我们预测房价
- 股票价格预测, 通过分析历史价格数据, 如公司财报, 宏观经济等信息, 决策树可以帮助我们预测股票未来价格
- 销售预测, 通过分析过去的销售数据, 促销活动, 季节性等因素, 决策树可以帮助我们预测未来的销售额
决策树的基本构建
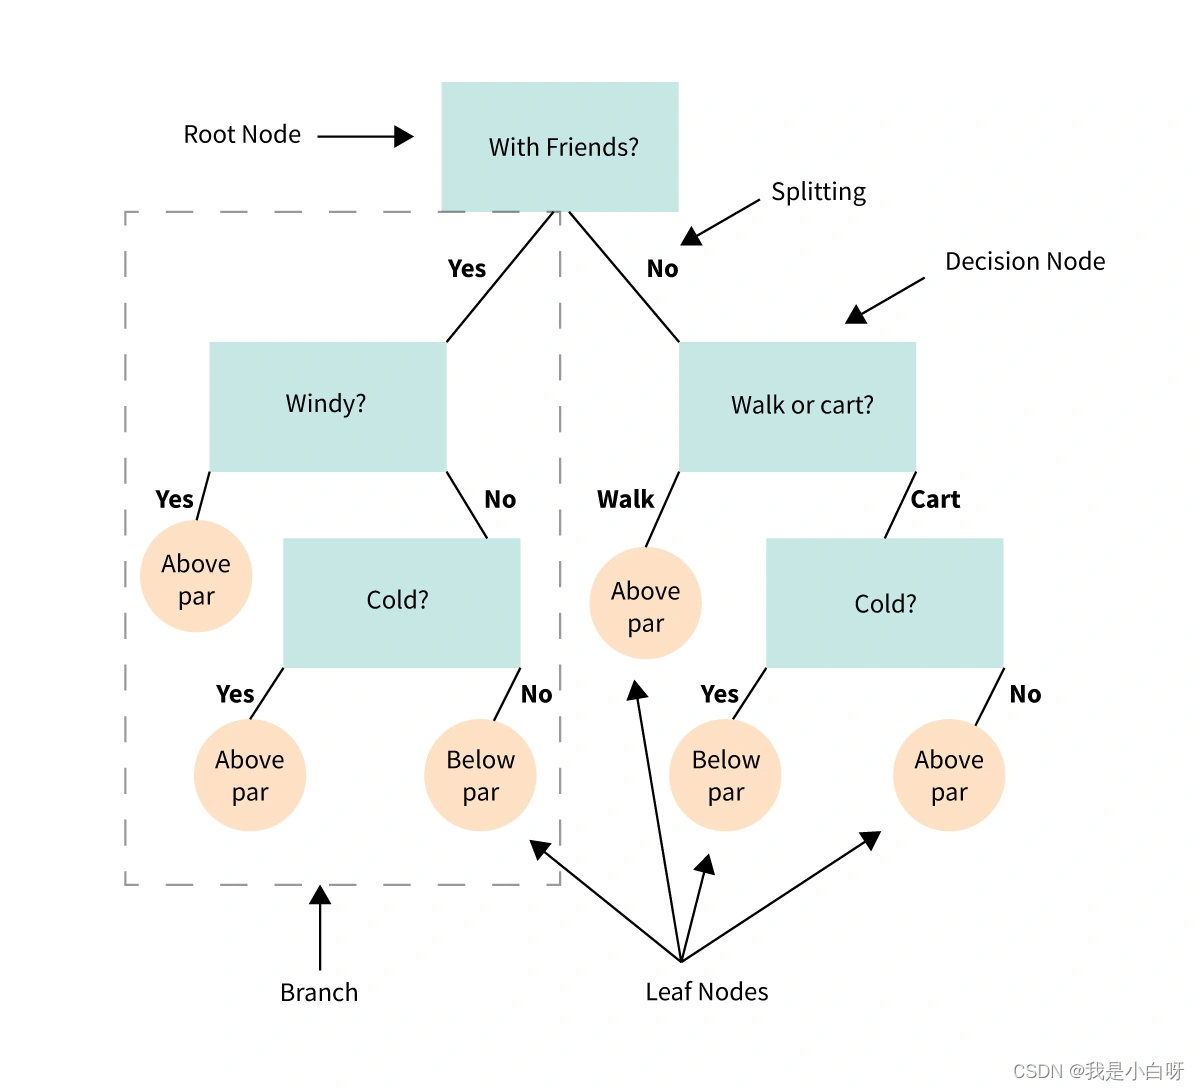
在我们深入探索决策树构建的过程中, 我们手写要理解决策树中的基本元素, 即节点 (Node) 和分支 (Branch).
节点 (Node)
决策树中的每个节点 (Node) 都包含了一个条件判断或一个分类输出.
根据节点的功能不同, 我们通常将其分为 3 类:
- 根节点 (Root Node): 决策树的起点
- 内部节点 (Internal Node): 数据的特征测试
- 叶节点 (Leaf Node): 包含决定的分类
分支 (Branch)
分支代表了从一个节点 (Node) 到另一个节点的转换. 也就是根据节点中的条件判断, 数据将沿着不同的分支走向不同的子节点 (Child Node).
通过节点和分支, 决策树模拟了一个逐步的决策过程, 从根节点开始, 通过一系列的条件判断, 最终达到叶节点, 得到决策结果.
决策树的构造过程
构建决策树主要包括选择属性和分割数据集两个关键步骤.
选择属性:
- 选择合适的属性作为节点的判断条件是决策树构建的核心. 通常我们会利用一些指标 (如信息增益, 基尼指数等) 来评估每个属性的分割效果, 选择最佳的属性作为当前节点的判断条件
创建分支:
- 在选择了合适的属性后, 我们需要根据该属性的不同取值, 来划分分支. 每个子集对应树中的一个分支. 例如, 如果我们选择的属性为 “颜色”, 颜色包括 “红”, “蓝”, “绿”, 那我们就创建三个分支
分割数据集:
- 根据分割属性的不同取值, 将数据集分割成若干个子集, 每个子集对应树中的一个分支. 每个子集中的数据都具有相同的属性取值.
构建子树:
- 对每个子集递归的构建子树, 直至所有的数据都被正确分类或达到预设的停止条件
举个例子:
我们有以下基于天气条件预测是否去野餐的数据:
| 天气 | 温度 | 是否去野餐 |
|---|---|---|
| 晴 | 高 | 是 |
| 晴 | 低 | 是 |
| 雨 | 高 | 否 |
| 雨 | 低 | 否 |
| 阴 | 高 | 是 |
| 阴 | 低 | 是 |
决策树构建过程:
- 选择属性: 选择属性来分隔数据集, 使用上述数据我们可以选择天气和温度两个属性. 我们通过计算信息增益发现 “晴天” 是最佳的分割属性
- 创建分支: 根据 “天气” 属性的三个可能取值 (晴, 雨, 阴), 我们创建三个分支
- 分割数据集: 根据 “天气” 分割成三个子集
- 晴天子集: {(高, 是), (低, 是)}
- 雨天子集: {(高, 否), (低, 否)}
- 阴天子集: {(高, 是), (低, 是)}
- 递归构建子树: 对于每个子集, 我们再次选择最佳的分割属性并分割数据, 直到满足停止条件
- 对于晴天和阴天子集: 所有数据属于同一类别 (去野餐), 所以我们可以停止分割, 并将这些节点标记为也节点, 叶节点的值为 “是”
- 对于雨天子集, 所有数据也都属于同一类别 (不去野餐), 所以我们也可以停止分割, 并将这个节点标记为叶节点, 叶节点的值为 “否”
信息增益
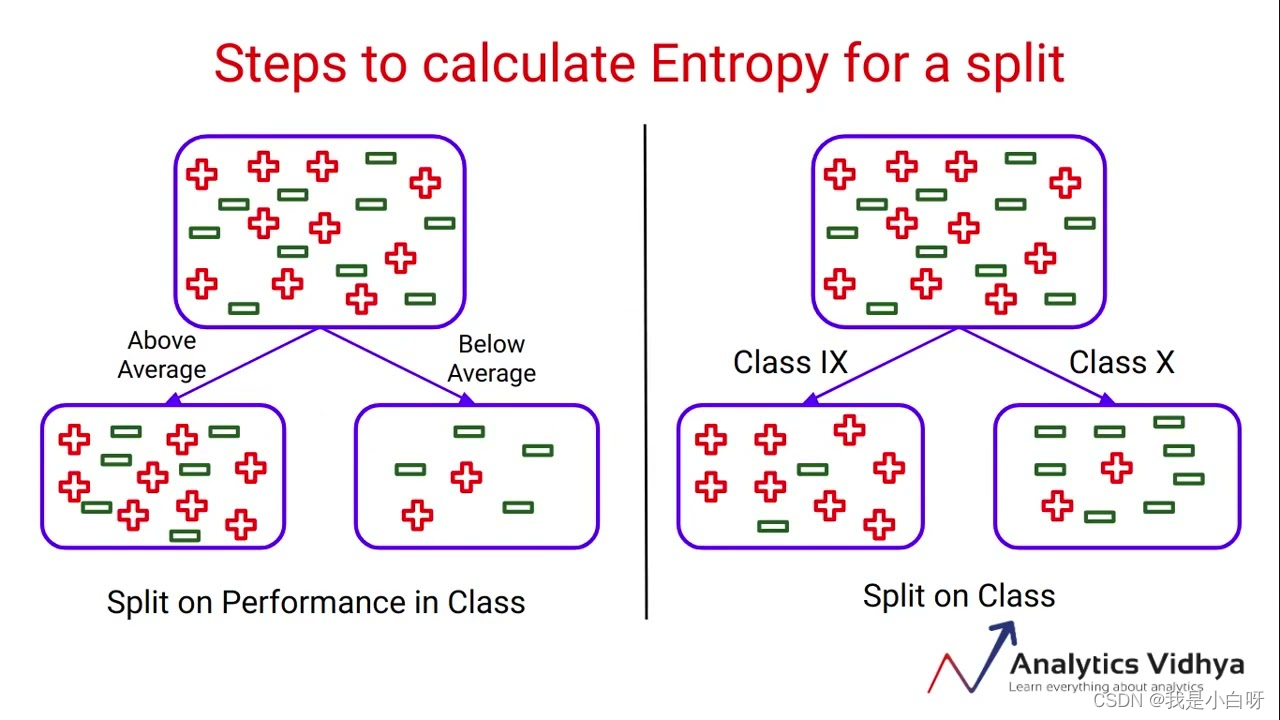
信息增益 (Information Gain) 是评估属性重要性的一种常用方法, 源于信息论中的熵 (Entropy) 的概念. 在决策树 (Decision Tree) 学习中, 信息增益用于选择能够最好地区分数据集的属性. 下面是信息增益的基本概念和计算方法.

熵 (Entropy)
熵 (Entropy) 指的是衡量数据不确定性的一个指标. 熵的值越大, 数据的不确定性就越高.
熵的公式:
H
(
D
)
=
?
∑
i
=
1
m
p
i
log
?
2
(
p
i
)
H(D) = -\sum\limits_{i=1}^{m}p_i\log_2(p_i)
H(D)=?i=1∑m?pi?log2?(pi?)
- m m m: 类别数量
- p i p_i pi?: 数据中第 i i i 类的比例
条件熵 (Conditional Entropy)
条件熵 (Conditional Entropy) 是在给定的条件下, 数据集的熵.
条件熵的公式:
H
(
D
∣
A
)
=
?
∑
j
=
1
v
∣
D
v
∣
D
H
(
D
v
)
H(D|A) = -\sum\limits_{j=1}^{v}\frac{|D^v|}{D}H(D^v)
H(D∣A)=?j=1∑v?D∣Dv∣?H(Dv)
- v v v: A 的可能值的数量
- D v D^v Dv: 属性 A 取第 v v v 个值时的子数据集, ∣ D v ∣ |D^v| ∣Dv∣ 和 ∣ D ∣ |D| ∣D∣ 分别是子数据集和原数据集的大小
信息增益 (Information Gain)
信息增益 (Information Gain) 是数据集的熵与给定某属性后的条件熵之差.
公式:
I
G
(
D
,
A
)
=
H
(
D
)
?
H
(
D
∣
A
)
IG(D, A) = H(D) - H(D|A)
IG(D,A)=H(D)?H(D∣A)
信息熵反映了通过属性 A 对数据集 D 进行分割所获得的信息量. 信息熵越大, 意味着属性 A 对数据集 D 的分类效果越好.
信息熵计算
我们来举个例子计算以下:
| 天气 | 温度 | 是否去野餐 |
|---|---|---|
| 晴 | 高 | 是 |
| 晴 | 低 | 是 |
| 雨 | 高 | 否 |
| 雨 | 低 | 否 |
| 阴 | 高 | 是 |
| 阴 | 低 | 是 |
计算数据集的熵
我们要两个分类: “是” 和 “否”, 在这个数据集中, 有 4 个 “是” 和 2 个 “否”, 我们可以得到:
p ( 是 ) = 4 6 p(是) = \frac{4}{6} p(是)=64?
p ( 否 ) = 2 6 p(否) = \frac{2}{6} p(否)=62?
所以, 数据集的熵 (Entropy) 是:
H ( D ) = ? [ p ( 是 ) × log ? 2 ( p ( 是 ) ) + p ( 否 ) ? l o g 2 ( p ( 否 ) ) ] H(D) = - [p(是) \times \log2(p(是)) + p(否) - log2(p(否))] H(D)=?[p(是)×log2(p(是))+p(否)?log2(p(否))]
H ( D ) = ? [ 4 6 × log ? 2 ( 4 6 ) + 2 6 × log ? 2 ( 2 6 ) ] H(D) = - [\frac{4}{6} \times \log2(\frac{4}{6}) + \frac{2}{6} \times \log2(\frac{2}{6})] H(D)=?[64?×log2(64?)+62?×log2(62?)]
H ( D ) = 0.918 H(D) = 0.918 H(D)=0.918
计算在给定属性条件下的熵
以天气为例:
当天气为晴的时候, 有 2 个 “是” 和 0 个 “否”
H ( D ∣ 天气 = 晴 ) = ? [ 2 2 × log ? 2 ( 2 2 ) + 0 ] = 0 H(D|天气 = 晴) = -[\frac{2}{2} \times \log2(\frac{2}{2}) + 0] = 0 H(D∣天气=晴)=?[22?×log2(22?)+0]=0
H ( D ∣ 天气 = 雨 ) = ? [ 0 + 2 2 × log ? 2 ( 2 2 ) ] = 0 H(D|天气 = 雨) = -[0 + \frac{2}{2} \times \log2(\frac{2}{2})] = 0 H(D∣天气=雨)=?[0+22?×log2(22?)]=0
H ( D ∣ 天气 = 阴 ) = ? [ 2 2 × log ? 2 ( 2 2 ) + 0 ] = 0 H(D|天气 = 阴) = -[\frac{2}{2} \times \log2(\frac{2}{2}) + 0] = 0 H(D∣天气=阴)=?[22?×log2(22?)+0]=0
然后我们计算天气属性的条件熵 (Conditional Entropy):
H ( D ∣ 天气 ) = 2 6 × H ( D ∣ 天气 = 晴 ) + 2 6 × H ( D ∣ 天气 = 雨 ) + 2 6 × H ( D ∣ 天气 = 阴 ) = 0 H(D|天气) = \frac{2}{6} \times H(D|天气 = 晴) + \frac{2}{6} \times H(D|天气 = 雨) + \frac{2}{6} \times H(D|天气 = 阴) = 0 H(D∣天气)=62?×H(D∣天气=晴)+62?×H(D∣天气=雨)+62?×H(D∣天气=阴)=0
计算信增益 (Information Gain)
I G ( D , 天气 ) = H ( D ) ? H ( D ∣ 天气 ) = 0.918 IG(D,天气) = H(D) - H(D|天气) = 0.918 IG(D,天气)=H(D)?H(D∣天气)=0.918
类似的计算可以应用于温度属性, 通过比较信息增益, 我们可以确定那个属性更适合来用于分割数据集. 在上述例子中, 天气属性提供了最大的信息增益, 所以我们拿天气作为决策树的分割属性.
常用的决策树算法
常见的几种决策树算法有: ID3, C4.5 和 CART.
ID3 (Iterative Dischotomiser 3)算法
ID3 算法采用自顶向下, 贪心的策略来构造决策树. 在每个节点选择一个属性来分割数据, 以便得到最大的信息增益.
ID3 算法容易受到噪声的影响, 并可能产生过你和的问题. 不能直接处理连续属性和缺失值.
ID3 示例:
import sys
import six
sys.modules['sklearn.externals.six'] = six
from id3 import Id3Estimator
from sklearn.datasets import load_iris
from sklearn.model_selection import train_test_split
from sklearn.metrics import accuracy_score


# 加载数据
iris = load_iris()
X_train, X_test, y_train, y_test = train_test_split(iris.data, iris.target, test_size=0.2, random_state=42)

# 创建ID3分类器实例
clf = Id3Estimator()

# 拟合模型
clf.fit(X_train, y_train)

# 预测
y_pred = clf.predict(X_test)

# 计算精度
accuracy = accuracy_score(y_test, y_pred)
print(f'Accuracy: {accuracy:.2f}')
输出结果:
Accuracy: 1.00
C4.5 算法
C4.5 算法是 ID3 算法的扩展, 通过一些优化来克服 ID3 的局限性. C4.5 算法适用信息增益率而不是信息增益来选择属性, 以减少对具有大量值的属性的偏好.
C4.5 引入了剪枝技术来避免过拟合, 通过构造数的过程中构造完树后删除一些不必要的节点来简化模型. C4.5 能够处理连续性和缺失值, 使其跟具实用性.
CART 算法
CART 算法是一个二叉树, 可以用于分类也可以用于回归任务. 在文磊问题中, CART 使用基尼指数来选择属性, 基尼指数衡量了数据集的不纯度. 基尼指数越小, 不纯度越低, 分类效果越好.
与 ID3 和 C4.5 的多路树不同, CART 采用二叉树结构, 每个节点有两个子节点, 这使得模型更简洁, 高效. 在回归问题中, CART 使用平方误差最小化准则来选择属性和分割数据.
CART 代码示例:
from sklearn.datasets import load_iris
from sklearn.tree import DecisionTreeClassifier
from sklearn.model_selection import train_test_split
from sklearn.metrics import accuracy_score

# 加载数据
iris = load_iris()
X_train, X_test, y_train, y_test = train_test_split(iris.data, iris.target, test_size=0.2, random_state=42)

# 创建决策树分类器实例
clf = DecisionTreeClassifier(random_state=42)

# 拟合模型
clf.fit(X_train, y_train)

# 预测
y_pred = clf.predict(X_test)

# 计算精度
accuracy = accuracy_score(y_test, y_pred)
print(f'Accuracy: {accuracy:.2f}')
输出结果:
Accuracy: 1.00
决策树的评估和剪枝
决策树 (Decision Tree) 构建的是一个迭代的过程, 为了得到高效且可靠的模型, 我们需要通过一些评估指标来度量决策树的性能, 并采用剪枝来优化模型. 这是决策树学习过程中至关重要的一环.
决策树的评估指标
评估指标 (Evaluation) 是我们衡量模型性能的基础, 对于决策树而言, 常用的评估指标包括精度, 召回率, 和 F1.
常见的评估指标:
- 精度 (Precision): 精度是指模型正确预测的正样本占所有预测为正的样本的比例, 精度反应模型的准确性
- 召回率 (Recall): 召回率是指模型正确预测的正样本占所有实际为正的样本的比例, 召回率反应了模型的完整性
- F1 值 (F1 Score): F1 值是精度和召回率的调和平均值, F1 是精度和召回率的一个平衡, 是评估模型综合性能的一个好指标
通过这些评估指标, 我们能够从不同的角度评价决策树的性能, 找出模型的优势和不足.
决策树的剪枝技术
为了防止模型过拟合 (Overfitting) 并提高模型的泛化能力, 剪枝技术不是必不可少的.
剪枝分为预剪枝和后剪枝两种:
- 预剪枝 (Pre-pruning): 预剪枝是在决策树构建过程中就进行剪枝, 常用的预剪枝技术包括设定最大深度, 设定最小划分样本数等. 通过预剪枝, 我们可以控制决策树的复杂度
- 后剪枝 (Post-pruning): 后剪枝在决策树构建完成后进行的. 常用的后剪枝技术包括错误率剪枝, 代价复杂度剪枝等. 后剪枝通常能得到更为精确的模型, 但计算成本较高
代码对比:
"""
@Module Name: 决策树 预剪枝vs后剪枝.py
@Author: CSDN@我是小白呀
@Date: October 19, 2023

Description:
决策树 预剪枝vs后剪枝
"""
from sklearn.tree import DecisionTreeClassifier
from sklearn.datasets import load_iris
from sklearn.model_selection import train_test_split

# 加载数据集
iris = load_iris()
X_train, X_test, y_train, y_test = train_test_split(iris.data, iris.target, random_state=0)

# 创建决策树分类器并设置最大深度为3 (预剪枝)
clf = DecisionTreeClassifier(max_depth=3, random_state=0)
clf.fit(X_train, y_train)

# 评估模型
print("预剪枝:")
print(f'Training accuracy: {clf.score(X_train, y_train)}')
print(f'Test accuracy: {clf.score(X_test, y_test)}')

# 设置ccp_alpha参数进行成本复杂度剪枝 (后剪枝)
clf_cost_complexity_pruned = DecisionTreeClassifier(ccp_alpha=0.02, random_state=0)
clf_cost_complexity_pruned.fit(X_train, y_train)

# 评估模型
print("后剪枝:")
print(f'Training accuracy (pruned): {clf_cost_complexity_pruned.score(X_train, y_train)}')
print(f'Test accuracy (pruned): {clf_cost_complexity_pruned.score(X_test, y_test)}')
输出结果:
预剪枝:
Training accuracy: 0.9821428571428571
Test accuracy: 0.9736842105263158
后剪枝:
Training accuracy (pruned): 0.9821428571428571
Test accuracy (pruned): 0.9736842105263158
决策树在机器学习中的应用
决策树是机器学习中非常通用的模型, 既可以用于分类, 也可以用于回归以及集成学习等任务.
分类任务
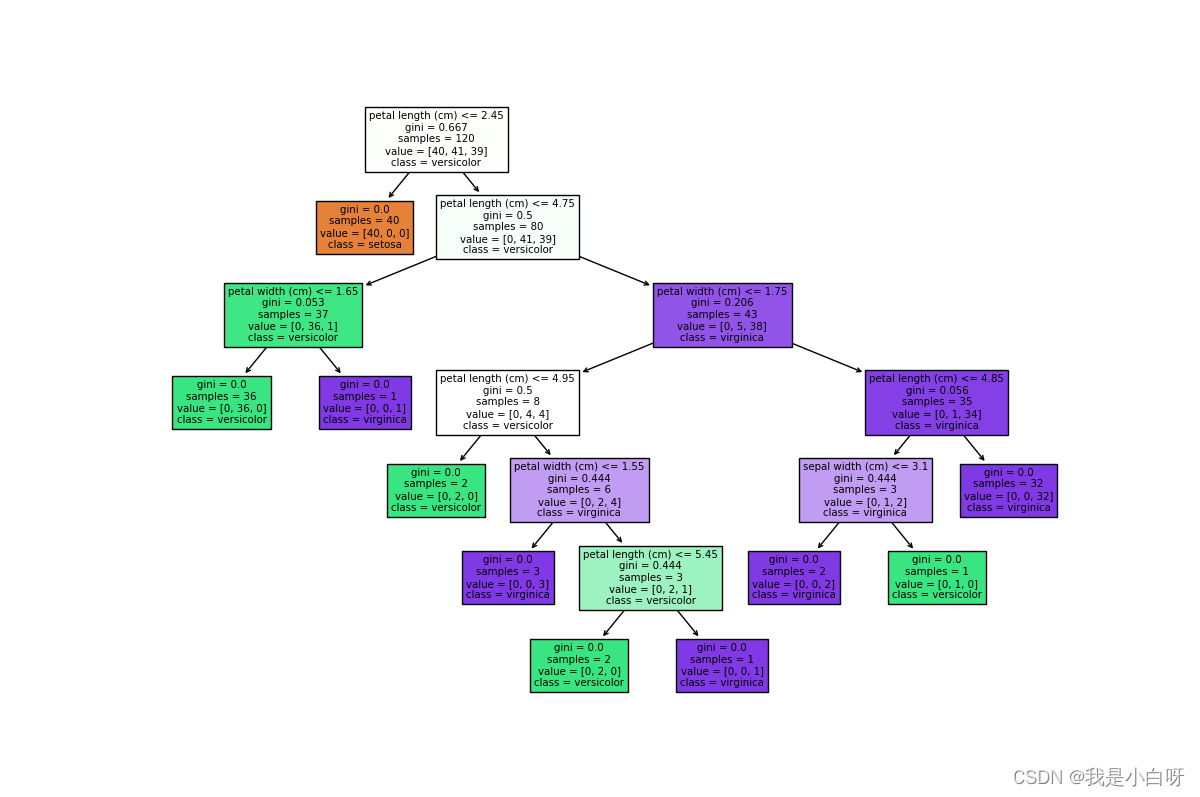
在分类任务中, 决策树通过学习数据的特征和标签之间的关系, 构建出一个用于分类的树形结构. 每个内部节点表示一个特征测试, 每个叶节点表示一个类别. 从根节点起始, 逐步测试特征值, 最终在也节点得到数据类别.
from sklearn.datasets import load_iris
from sklearn.tree import DecisionTreeClassifier, plot_tree
from sklearn.model_selection import train_test_split
from sklearn.metrics import accuracy_score
import matplotlib.pyplot as plt


# 加载数据
iris = load_iris()
X, y = iris.data, iris.target

# 分割数据为训练集和测试集
X_train, X_test, y_train, y_test = train_test_split(X, y, test_size=0.2, random_state=42)

# 创建决策树分类器
clf = DecisionTreeClassifier(random_state=42)

# 拟合模型
clf.fit(X_train, y_train)

# 在测试集上进行预测
y_pred = clf.predict(X_test)

# 计算准确率
accuracy = accuracy_score(y_test, y_pred)
print(f'Accuracy: {accuracy * 100:.2f}%')

# 使用 plot_tree 进行可视化
plt.figure(figsize=(12, 8))
plot_tree(clf, feature_names=iris.feature_names, class_names=iris.target_names, filled=True)
plt.show()
输出结果:

回归任务
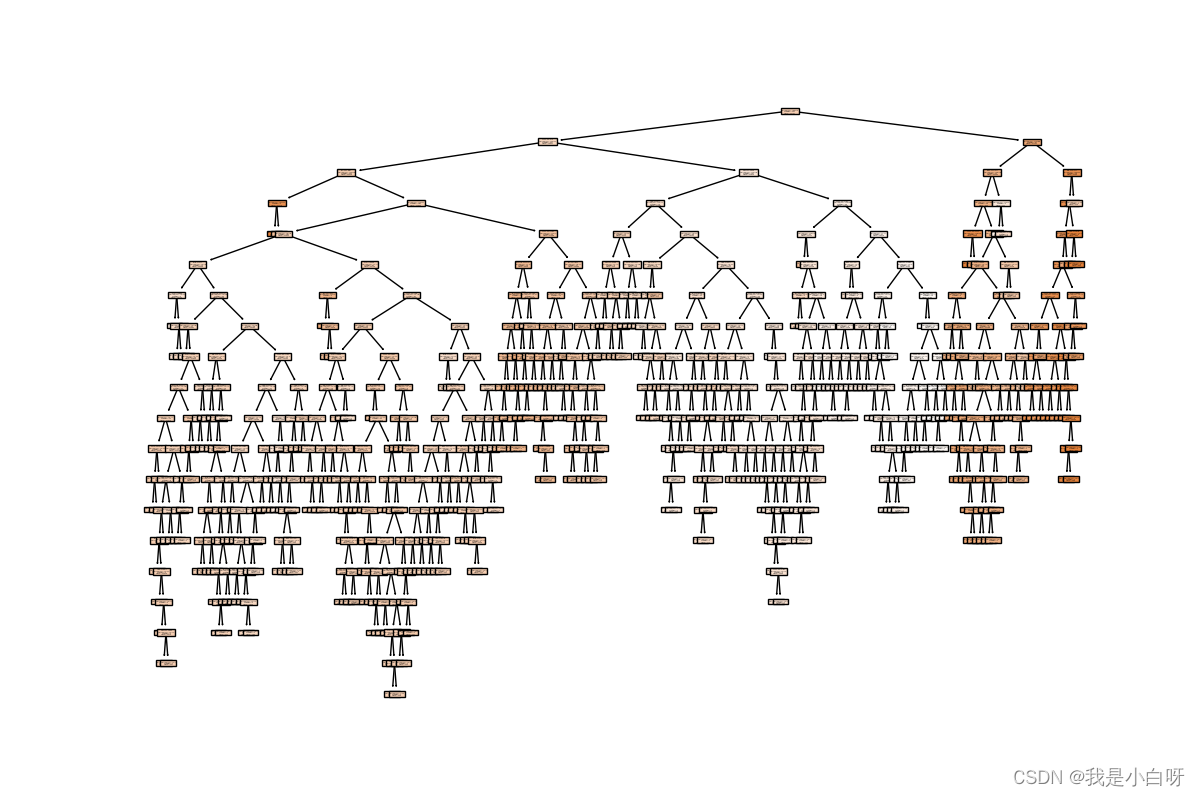
在回归任务中, 决策树的目标是预测一个连续值. 与分类树略有不同. 回归树的也节点包含的是一个实数值, 而不是类别标签.
from sklearn.datasets import load_boston
from sklearn.tree import DecisionTreeRegressor, plot_tree
from sklearn.model_selection import train_test_split
from sklearn.metrics import mean_squared_error
import matplotlib.pyplot as plt


# 加载数据
boston = load_boston()
X, y = boston.data, boston.target

# 分割数据为训练集和测试集
X_train, X_test, y_train, y_test = train_test_split(X, y, test_size=0.2, random_state=42)

# 创建决策树回归器
reg = DecisionTreeRegressor(random_state=42)

# 拟合模型
reg.fit(X_train, y_train)

# 在测试集上进行预测
y_pred = reg.predict(X_test)

# 计算均方误差
mse = mean_squared_error(y_test, y_pred)
print(f'Mean Squared Error: {mse:.2f}')

# 使用 plot_tree 进行可视化
plt.figure(figsize=(12, 8))
plot_tree(reg, feature_names=boston.feature_names, filled=True)
plt.show()
输出结果:

决策树的优缺点
决策树作为一种节本且使用的机器学习模型, 在很多实际应用中都取得了良好的效果. 下面我们来说一下优缺点.
决策树的优点
- 简单和直观: 决策树 (Decision Tree) 的结构非常简单, 模拟量人类的决策过程, 使得模型的解释. 通过可视化决策树, 我们可以清晰的看到每个决策和分支条件
- 计算效率高: 决策树的训练和预测过程都是非常高效的. 决策树不需要任何预处理或标准化, 而且能够直接村里分类和连续特征, 这使得决策树在实际应用中方便且快速
决策树的缺点
- 容易过拟合: 决策树很容易过拟合, 特别是当树的深度较大时. 过拟合可能会导致模型在训练数据上表现良好, 但在测试集上表现欠佳
- 对噪声敏感: 决策树对数据中的噪声和异常值非常敏感, 稍微的噪声都可能导致生成完全不同的树
手搓决策树
"""
@Module Name: 手把手教你实现决策树.py
@Author: CSDN@我是小白呀
@Date: October 20, 2023

Description:
手把手教你实现决策树
"""
import numpy as np


class TreeNode:
    def __init__(self, gini, num_samples, num_samples_per_class, predicted_class):
        self.gini = gini
        self.num_samples = num_samples
        self.num_samples_per_class = num_samples_per_class
        self.predicted_class = predicted_class
        self.feature_index = 0
        self.threshold = 0
        self.left = None
        self.right = None


def gini(y):
    m = len(y)
    return 1.0 - sum((np.sum(y == c) / m) ** 2 for c in range(num_classes))


def grow_tree(X, y, depth=0, max_depth=None):
    num_samples_per_class = [np.sum(y == i) for i in range(num_classes)]
    predicted_class = np.argmax(num_samples_per_class)
    node = TreeNode(
        gini=gini(y),
        num_samples=len(y),
        num_samples_per_class=num_samples_per_class,
        predicted_class=predicted_class,
    )

    if depth < max_depth:
        idx, thr = best_split(X, y)
        if idx is not None:
            indices_left = X[:, idx] < thr
            X_left, y_left = X[indices_left], y[indices_left]
            X_right, y_right = X[~indices_left], y[~indices_left]
            node.feature_index = idx
            node.threshold = thr
            node.left = grow_tree(X_left, y_left, depth + 1, max_depth)
            node.right = grow_tree(X_right, y_right, depth + 1, max_depth)
    return node


def best_split(X, y):
    m, n = X.shape
    if m <= 1:
        return None, None

    num_parent = [np.sum(y == c) for c in range(num_classes)]
    best_gini = 1.0 - sum((num / m) ** 2 for num in num_parent)
    best_idx, best_thr = None, None

    for idx in range(n):
        thresholds, classes = zip(*sorted(zip(X[:, idx], y)))
        num_left = [0] * num_classes
        num_right = num_parent.copy()
        for i in range(1, m):
            c = classes[i - 1]
            num_left[c] += 1
            num_right[c] -= 1
            gini_left = 1.0 - sum(
                (num_left[x] / i) ** 2 for x in range(num_classes)
            )
            gini_right = 1.0 - sum(
                (num_right[x] / (m - i)) ** 2 for x in range(num_classes)
            )
            gini = (i * gini_left + (m - i) * gini_right) / m
            if thresholds[i] == thresholds[i - 1]:
                continue
            if gini < best_gini:
                best_gini = gini
                best_idx = idx
                best_thr = (thresholds[i] + thresholds[i - 1]) / 2
    return best_idx, best_thr


def predict_tree(node, X):
    if node.left is None and node.right is None:
        return node.predicted_class * np.ones(X.shape[0], dtype=int)

    left_idx = (X[:, node.feature_index] < node.threshold)
    right_idx = ~left_idx

    y = np.empty(X.shape[0], dtype=int)
    y[left_idx] = predict_tree(node.left, X[left_idx])
    y[right_idx] = predict_tree(node.right, X[right_idx])

    return y


def train_tree(X, y, max_depth=None):
    global num_classes
    num_classes = len(set(y))
    tree = grow_tree(X, y, max_depth=max_depth)
    return tree

if __name__ == '__main__':
    from sklearn.datasets import load_iris
    from sklearn.tree import DecisionTreeClassifier
    from sklearn.model_selection import train_test_split
    from sklearn.metrics import accuracy_score

    # 加载数据
    iris = load_iris()
    X, y = iris.data, iris.target

    # 分割数据为训练集和测试集
    X_train, X_test, y_train, y_test = train_test_split(X, y, test_size=0.2, random_state=42)

    # 创建决策树分类器
    clf = DecisionTreeClassifier(random_state=42)

    # 拟合模型
    clf.fit(X_train, y_train)

    # 在测试集上进行预测
    y_pred = clf.predict(X_test)

    # 计算准确率
    accuracy = accuracy_score(y_test, y_pred)
    print(f'Accuracy: {accuracy * 100:.2f}%')
本文来自互联网用户投稿,该文观点仅代表作者本人,不代表本站立场。本站仅提供信息存储空间服务,不拥有所有权,不承担相关法律责任。 如若内容造成侵权/违法违规/事实不符,请联系我的编程经验分享网邮箱:chenni525@qq.com进行投诉反馈,一经查实,立即删除!
- Python教程
- 深入理解 MySQL 中的 HAVING 关键字和聚合函数
- Qt之QChar编码(1)
- MyBatis入门基础篇
- 用Python脚本实现FFmpeg批量转换
- 15:00面试,15:07就出来了,问的问题有点变态。。。
- 【UML】第9篇 类图
- 希尔顿集团旗下LXR酒店及度假村东南亚首秀,巴厘岛乌玛纳耀世启幕
- 【Java 设计模式】结构型之装饰器模式
- 通过AWS Endpoints从内网访问S3
- 【教程】代码混淆详解
- 实验室安全教育考试管理系统v3.0功能介绍
- 【elfboard linux开发板】4. 文件点灯与创建多进程
- 探讨APP自动化测试工具的重要性
- 系统学习Python——类(class):静态方法(staticmethod)和类方法(classmethod)-[初识Python中的静态方法]