VlnPlot画的其实不是原始数据
发布时间:2024年01月07日
昨天的推文描述了让小提琴图肚子变大的做法:让你的小提琴肚子大起来?????????????
在此说明:这种不考虑后果,就让肚子大起来的做法是不严谨的。如需使用,建议将原始图和修改图放在一起对比,且在文章中注明。因为我们去掉0之后就改变了本身的数据分布
1.今天聊聊:如何用ggplot代替Vlnplot画图
1.?seurat包中Vlnplot
.libPaths(c( "/home/data/t040413/R/x86_64-pc-linux-gnu-library/4.2","/home/data/t040413/R/yll/usr/local/lib/R/site-library","/home/data/refdir/Rlib/", "/usr/local/lib/R/library"))?sessionInfo()getwd()?library(Seurat)pbmc=readRDS("~/gzh/featureplot_dotplot_vlnplot/pbmc3k_final.rds")VlnPlot(pbmc,features = 'CD4',pt.size = 1)?

2.?使用ggplot完全复现Vlnplot
p=VlnPlot(pbmc,features = 'CD4',slot = 'data')head(p$data)ggplot(p$data ,aes(ident,CD4,fill=ident)) +geom_violin(scale = "width", trim = T ) +geom_jitter( )+ theme_bw()+RotatedAxis()?


如果不喜欢网格,使用theme_classic()主题就可以了,
如果想调节肚子大小,主要是 geom_violin中的scale和adjust两个参数
2.Vlnplot画图数据是经过“噪音”处理的
我们来观察一下画图所需要的的数据
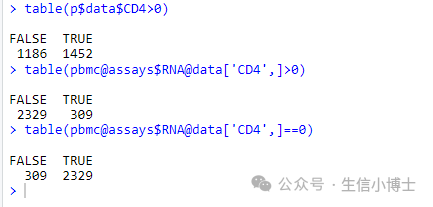
1.?不知是否有读者发现,上图CD4的值有负数,但是我们看到原始的画图数据是没有负数的,其取值范围是【0.000000,4.311621】,如下图。
data=FetchData(object = pbmc, vars = 'CD4', slot = 'data')head(data)range(data$CD4)

2. 这就说明我们的画图数据和原始数据是不一样的,为什么呢?然后我去查了一下Vlnplot画图的源代码,结果发现:
vlnplot画图时,给数据添加了噪音 (除了加噪音,Vlnplot还可以选择是否log,在此不表)
data <- FetchData(object = object, vars = features, slot = slot)....noise <- rnorm(n = length(x = data[, feature]))/1e+05#rnorm()?函数用于生成正态分布的随机数。#在上述代码中,n 参数指定了噪声的长度,等于 data[, feature]?列的长度。因此,noise 是一个长度为 data[, feature]?列长度的正态分布随机数向量。#正态噪音是一种常用的随机噪音类型。它具有对称性和均匀性,可以模拟真实数据中的噪声。?
使用trim = F 参数,就可以看到小于0的部分。那些数据都是加了噪音的0
p=VlnPlot(pbmc,features = 'CD4',slot = 'data')head(p$data)ggplot(p$data ,aes(ident,CD4,fill=ident)) +geom_violin(scale = "width", trim = F ,width=1, adjust = 0.6) + # after_stat(density)( kernel="gaussian") + #"rectangular"# geom_boxplot(width = 0.2, fill = "red") +geom_jitter(alpha=0.02 )+ theme_classic()+RotatedAxis()?

当然,大于0部分肯定也有噪音啊,不过这些噪音都特别小,主要还是为了美化图表
3.开放问题
-
1.你认同seurat包中这种加噪音的方式吗?
-
2.你觉得这种方式是数据造假吗:让你的小提琴肚子大起来
最后,特别鸣谢Jimmy老师

。
大家平时有问题也可以看看生信技能树、单细胞天地、生信菜鸟团公众号。
源代码详细内容,大家可以看下,部分内容我做了注释:
VlnPlot---->ExIPlot--->SingleExIPlot
> debug(Seurat:: VlnPlot)?> VlnPlot(pbmc3, "CD4",slot = "data")debugging in: VlnPlot(pbmc3, "CD4", slot = "data")?debug: {if (!is.null(x = split.by) & getOption(x = "Seurat.warn.vlnplot.split",default = TRUE)) {message("The default behaviour of split.by has changed.\n","Separate violin plots are now plotted side-by-side.\n","To restore the old behaviour of a single split violin,\n","set split.plot = TRUE.\n \nThis message will be shown once per session.")options(Seurat.warn.vlnplot.split = FALSE)}return(ExIPlot(object = object, type = ifelse(test = split.plot,yes = "splitViolin", no = "violin"), features = features,idents = idents, ncol = ncol, sort = sort, assay = assay,y.max = y.max, same.y.lims = same.y.lims, adjust = adjust,pt.size = pt.size, cols = cols, group.by = group.by,split.by = split.by, log = log, slot = slot, stack = stack,combine = combine, fill.by = fill.by, flip = flip, add.noise = add.noise,raster = raster))}Browse[2]>debug: if (!is.null(x = split.by) & getOption(x = "Seurat.warn.vlnplot.split",default = TRUE)) {message("The default behaviour of split.by has changed.\n","Separate violin plots are now plotted side-by-side.\n","To restore the old behaviour of a single split violin,\n","set split.plot = TRUE.\n \nThis message will be shown once per session.")options(Seurat.warn.vlnplot.split = FALSE)}?Browse[2]>debug: return(ExIPlot(object = object, type = ifelse(test = split.plot,yes = "splitViolin", no = "violin"), features = features,idents = idents, ncol = ncol, sort = sort, assay = assay,y.max = y.max, same.y.lims = same.y.lims, adjust = adjust,pt.size = pt.size, cols = cols, group.by = group.by, split.by = split.by,log = log, slot = slot, stack = stack, combine = combine,fill.by = fill.by, flip = flip, add.noise = add.noise, raster = raster))Browse[2]> ExIPlot?function (object, features, type = "violin", idents = NULL, ncol = NULL,sort = FALSE, assay = NULL, y.max = NULL, same.y.lims = FALSE,adjust = 1, cols = NULL, pt.size = 0, group.by = NULL, split.by = NULL,log = FALSE, slot = "data", stack = FALSE, combine = TRUE,fill.by = NULL, flip = FALSE, add.noise = TRUE, raster = NULL){?#在 R 语言中,%||% 运算符称为“或,否则返回”。#它的作用是,如果左边的表达式值不为空,则返回左边的表达式值;# 如果左边的表达式值为空,则返回右边的表达式值。????assay?<-?assay?%||%?DefaultAssay(object?=?object)#首先检查 assay 参数是否为空。如果为空,则将其设置为 DefaultAssay()?函数的返回值。#DefaultAssay()?函数将返回 Seurat 对象的默认测量数据集。????DefaultAssay(object = object) <- assayif (isTRUE(x = stack)) {if (!is.null(x = ncol)) {warning("'ncol' is ignored with 'stack' is TRUE",call. = FALSE, immediate. = TRUE)}if (!is.null(x = y.max)) {warning("'y.max' is ignored when 'stack' is TRUE",call. = FALSE, immediate. = TRUE)}}else {????#?这里的ncol目的:根据给定的基因个数来决定最终展示的图形分成几列????ncol <- ncol %||% ifelse(test = length(x = features) >9, yes = 4, no = min(length(x = features), 3))}#获取画图的数据,极其关键的步骤data <- FetchData(object = object, vars = features, slot = slot)pt.size <- pt.size %||% AutoPointSize(data = object)features <- colnames(x = data)???#This code snippet ensures that the correct cells are used for generating the violin plot, based on whether specific cell identities have been requested for plotting.if (is.null(x = idents)) {cells <- colnames(x = object)}else {?#Idents(object = object)() 括号用于调用函数。如果函数只有一个参数,则通常可以省略括号。#但是,在某些情况下,括号仍然是必要的。cells <- names(x = Idents(object = object)[Idents(object = object) %in%idents])}??#这个地方不太好理解,不知道对不对~???#在 R 语言中,[ 运算符用于访问矩阵或列表中的元素。#在 data[cells, , drop = FALSE] 中,第一个参数是 data 矩阵。第二个参数是 cells 向量,它指定要访问的元素的索引。#第三个参数是 drop = FALSE,它指定将结果保留为矩阵?data <- data[cells, , drop = FALSE]idents <- if (is.null(x = group.by)) {Idents(object = object)[cells]}else {object[[group.by, drop = TRUE]][cells]}if (!is.factor(x = idents)) {idents <- factor(x = idents)}if (is.null(x = split.by)) {split <- NULL}else {split <- object[[split.by, drop = TRUE]][cells]if (!is.factor(x = split)) {split <- factor(x = split)}if (is.null(x = cols)) {cols <- hue_pal()(length(x = levels(x = idents)))cols <- Interleave(cols, InvertHex(hexadecimal = cols))}else if (length(x = cols) == 1 && cols == "interaction") {split <- interaction(idents, split)cols <- hue_pal()(length(x = levels(x = idents)))}else {cols <- Col2Hex(cols)}if (length(x = cols) < length(x = levels(x = split))) {cols <- Interleave(cols, InvertHex(hexadecimal = cols))}cols <- rep_len(x = cols, length.out = length(x = levels(x = split)))names(x = cols) <- levels(x = split)if ((length(x = cols) > 2) & (type == "splitViolin")) {warning("Split violin is only supported for <3 groups, using multi-violin.")type <- "violin"}}if (same.y.lims && is.null(x = y.max)) {y.max <- max(data)}?if (isTRUE(x = stack)) {return(MultiExIPlot(type = type, data = data, idents = idents,split = split, sort = sort, same.y.lims = same.y.lims,adjust = adjust, cols = cols, pt.size = pt.size,log = log, fill.by = fill.by, add.noise = add.noise,flip = flip))}?plots <- lapply(X = features, FUN = function(x) {return(SingleExIPlot(type = type, data = data[, x, drop = FALSE],idents = idents, split = split, sort = sort, y.max = y.max,adjust = adjust, cols = cols, pt.size = pt.size,log = log, add.noise = add.noise, raster = raster))})label.fxn <- switch(EXPR = type, violin = if (stack) {xlab} else {ylab}, splitViolin = if (stack) {xlab} else {ylab}, ridge = xlab, stop("Unknown ExIPlot type ", type, call. = FALSE))?for (i in 1:length(x = plots)) {key <- paste0(unlist(x = strsplit(x = features[i], split = "_"))[1],"_")obj <- names(x = which(x = Key(object = object) == key))if (length(x = obj) == 1) {if (inherits(x = object[[obj]], what = "DimReduc")) {plots[[i]] <- plots[[i]] + label.fxn(label = "Embeddings Value")}else if (inherits(x = object[[obj]], what = "Assay")) {next}else {warning("Unknown object type ", class(x = object),immediate. = TRUE, call. = FALSE)plots[[i]] <- plots[[i]] + label.fxn(label = NULL)}}else if (!features[i] %in% rownames(x = object)) {plots[[i]] <- plots[[i]] + label.fxn(label = NULL)}}if (combine) {plots <- wrap_plots(plots, ncol = ncol)if (length(x = features) > 1) {plots <- plots & NoLegend()}}return(plots)}<bytecode: 0x565001d8f568><environment: namespace:Seurat>########################################################################################3333??Browse[2]> SingleExIPlotfunction (data, idents, split = NULL, type = "violin", sort = FALSE,y.max = NULL, adjust = 1, pt.size = 0, cols = NULL, seed.use = 42,log = FALSE, add.noise = TRUE, raster = NULL){if (!is.null(x = raster) && isTRUE(x = raster)) {if (!PackageCheck("ggrastr", error = FALSE)) {stop("Please install ggrastr from CRAN to enable rasterization.")}}if (PackageCheck("ggrastr", error = FALSE)) {if ((nrow(x = data) > 1e+05) & !isFALSE(raster)) {message("Rasterizing points since number of points exceeds 100,000.","\nTo disable this behavior set `raster=FALSE`")raster <- TRUE}}if (!is.null(x = seed.use)) {set.seed(seed = seed.use)}??#在 R 语言中,||?运算符称为“或,否则返回”。它的作用是,如果左边的表达式值为真,则返回左边的表达式值;如果左边的表达式值为假,则返回右边的表达式值。?#在 if (!is.data.frame(x = data) || ncol(x = data) != 1) { 中,|| 运算符用于检查 data 对象是否是数据框并且是否只有一个列。#如果 data 对象不是数据框,则 is.data.frame(x = data) 表达式值为假,|| 运算符返回右边的表达式值 ncol(x = data) != 1。ncol(x = data) != 1 表达式值也为假,因此 if 语句的条件不满足,stop() 函数会被调用,导致程序中止。??if (!is.data.frame(x = data) || ncol(x = data) != 1) {stop("'SingleExIPlot requires a data frame with 1 column")}feature <- colnames(x = data)data$ident <- identsif ((is.character(x = sort) && nchar(x = sort) > 0) || sort) {data$ident <- factor(x = data$ident, levels = names(x = rev(x = sort(x = tapply(X = data[,feature], INDEX = data$ident, FUN = mean), decreasing = grepl(pattern = paste0("^",tolower(x = sort)), x = "decreasing")))))}if (log) {noise <- rnorm(n = length(x = data[, feature]))/200data[, feature] <- data[, feature] + 1}?#rnorm()?函数用于生成正态分布的随机数。#在上述代码中,n 参数指定了噪声的长度,等于 data[, feature]?列的长度。因此,noise 是一个长度为 data[, feature]?列长度的正态分布随机数向量。?#正态噪音是一种常用的随机噪音类型。它具有对称性和均匀性,可以模拟真实数据中的噪声。else {noise <- rnorm(n = length(x = data[, feature]))/1e+05}??if (!add.noise) {noise <- noise * 0}if (all(data[, feature] == data[, feature][1])) {warning(paste0("All cells have the same value of ", feature,"."))}else {data[, feature] <- data[, feature] + noise}??axis.label <- "Expression Level"y.max <- y.max %||% max(data[, feature][is.finite(x = data[,feature])])if (type == "violin" && !is.null(x = split)) {data$split <- splitvln.geom <- geom_violinfill <- "split"}?else if (type == "splitViolin" && !is.null(x = split)) {data$split <- splitvln.geom <- geom_split_violinfill <- "split"type <- "violin"}else {vln.geom <- geom_violinfill <- "ident"}???##################################################################3#switch(EXPR = type, ...): It uses a switch statement to execute different code blocks based on the type argument, determining the plot type to create.#根据type执行不同的代码块'''2. Violin Plot Configuration:?If type == "violin":Sets x = "ident", y = feature, xlab = "Identity", ylab = axis.label.Creates violin plot elements using geom_violin or geom_split_violin based on split.Optionally adds jittered points for individual cell visualization.Applies log scaling if log = TRUE.3. Ridge Plot Configuration:?If type == "ridge":Sets x = feature, y = "ident", xlab = axis.label, ylab = "Identity".Creates ridge plot elements using geom_density_ridges.Optionally adds jittered points.Applies log scaling if log = TRUE.'''???switch(EXPR = type, violin = {x <- "ident"y <- paste0("`", feature, "`")xlab <- "Identity"ylab <- axis.label??#geom <- list(...): This line creates a list named geom to store geometric elements that will be added to the ggplot object.??geom <- list(vln.geom(scale = "width", adjust = adjust,trim = TRUE), theme(axis.text.x = element_text(angle = 45,hjust = 1)))?#vlnplot调整图形胖瘦的核心参数?geom#scale = "width": Scales the violins based on the number of observations in each group, ensuring equal widths.#adjust = adjust: Adjusts the bandwidth of the kernel density estimation used to create the violin shapes. This value likely comes from a user-specified argument.#trim = TRUE: Trims the violins at the extremes to limit the influence of outliers.???if (is.null(x = split)) {if (isTRUE(x = raster)) {jitter <- ggrastr::rasterize(geom_jitter(height = 0,size = pt.size, show.legend = FALSE))} else {jitter <- geom_jitter(height = 0, size = pt.size,show.legend = FALSE)}} else {if (isTRUE(x = raster)) {jitter <- ggrastr::rasterize(geom_jitter(position = position_jitterdodge(jitter.width = 0.4,dodge.width = 0.9), size = pt.size, show.legend = FALSE))} else {jitter <- geom_jitter(position = position_jitterdodge(jitter.width = 0.4,dodge.width = 0.9), size = pt.size, show.legend = FALSE)}}log.scale <- scale_y_log10()axis.scale <- ylim?}, ridge = {x <- paste0("`", feature, "`")y <- "ident"xlab <- axis.labelylab <- "Identity"geom <- list(geom_density_ridges(scale = 4), theme_ridges(),scale_y_discrete(expand = c(0.01, 0)), scale_x_continuous(expand = c(0,0)))jitter <- geom_jitter(width = 0, size = pt.size, show.legend = FALSE)log.scale <- scale_x_log10()axis.scale <- function(...) {invisible(x = NULL)}}, stop("Unknown plot type: ", type))??plot <- ggplot(data = data, mapping = aes_string(x = x, y = y,fill = fill)[c(2, 3, 1)]) + labs(x = xlab, y = ylab,title = feature, fill = NULL) + theme_cowplot() +theme(plot.title = element_text(hjust = 0.5))?plot <- do.call(what = "+", args = list(plot, geom))?plot <- plot + if (log) {log.scale}else {axis.scale(min(data[, feature]), y.max)}if (pt.size > 0) {plot <- plot + jitter}?if (!is.null(x = cols)) {if (!is.null(x = split)) {idents <- unique(x = as.vector(x = data$ident))splits <- unique(x = as.vector(x = data$split))labels <- if (length(x = splits) == 2) {splits}else {unlist(x = lapply(X = idents, FUN = function(pattern,x) {x.mod <- gsub(pattern = paste0(pattern, "."),replacement = paste0(pattern, ": "), x = x,fixed = TRUE)x.keep <- grep(pattern = ": ", x = x.mod, fixed = TRUE)x.return <- x.mod[x.keep]names(x = x.return) <- x[x.keep]return(x.return)}, x = unique(x = as.vector(x = data$split))))}if (is.null(x = names(x = labels))) {names(x = labels) <- labels}}else {labels <- levels(x = droplevels(data$ident))}plot <- plot + scale_fill_manual(values = cols, labels = labels)}return(plot)}<bytecode: 0x564ff95dec80><environment: namespace:Seurat>?
文章来源:https://blog.csdn.net/qq_52813185/article/details/135442168
本文来自互联网用户投稿,该文观点仅代表作者本人,不代表本站立场。本站仅提供信息存储空间服务,不拥有所有权,不承担相关法律责任。 如若内容造成侵权/违法违规/事实不符,请联系我的编程经验分享网邮箱:chenni525@qq.com进行投诉反馈,一经查实,立即删除!
本文来自互联网用户投稿,该文观点仅代表作者本人,不代表本站立场。本站仅提供信息存储空间服务,不拥有所有权,不承担相关法律责任。 如若内容造成侵权/违法违规/事实不符,请联系我的编程经验分享网邮箱:chenni525@qq.com进行投诉反馈,一经查实,立即删除!
最新文章
- Python教程
- 深入理解 MySQL 中的 HAVING 关键字和聚合函数
- Qt之QChar编码(1)
- MyBatis入门基础篇
- 用Python脚本实现FFmpeg批量转换
- springcloud-分布式缓存
- Java重修第五天—面向对象3
- GBASE南大通用 ADO.NET 中的事务
- HP ENVY x360 Convertible 15-ed1xxx原厂Windows11系统22H2
- 网络安全产品之认识WEB应用防火墙
- 【LeetCode刷题笔记】贪心
- Woodpecker CI 设计分析|一个 Go 编写的开源持续集成引擎
- Linux 操作系统 002-VMware Workstation的相关操作
- 燃油车智能化时代将终结,长安汽车凭啥引领“数智新汽车”周期?
- HTML-鼠标悬浮文案效果