Spring Boot 中的虚拟线程
发布时间:2023年12月27日
在本文中,我将讨论 Spring Boot 中的虚拟线程。
什么是虚拟线程?
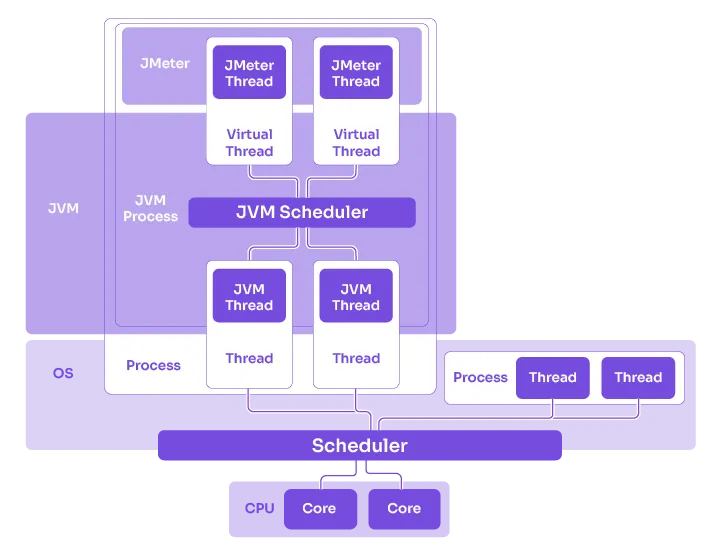
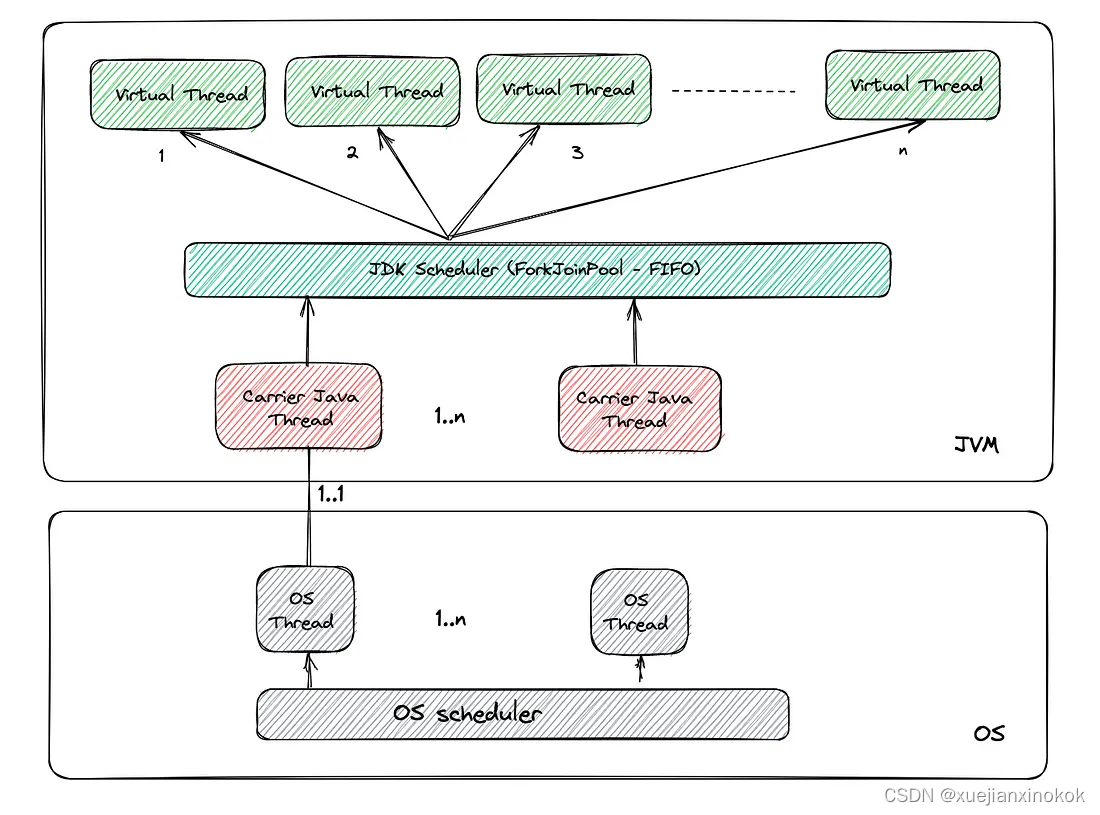
虚拟线程作为 Java 中的一项功能引入,旨在简化并发性。 Virtual threads 是 轻量级的线程,由 Java Virtual Machine 而不是操作系统管理。它们被设计为易于使用且高效,为并发编程提供了比传统 Java 线程更简单的模型。
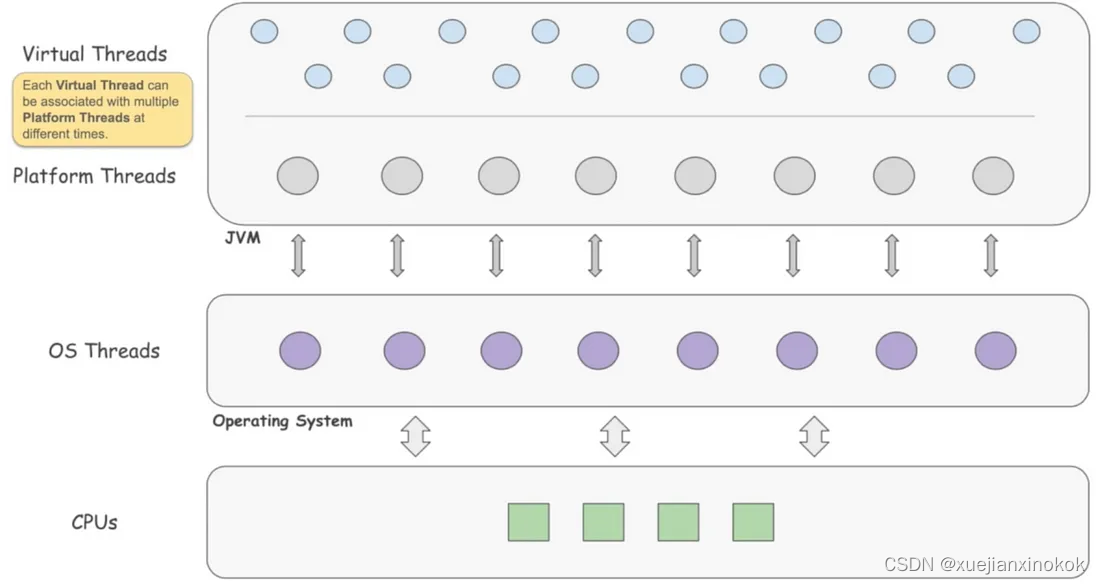
- Lightweight :与传统线程相比,虚拟线程的重量更轻。它们由 JVM 管理,许多虚拟线程可以映射到较少数量的操作系统线程。
- Concurrency :虚拟线程旨在通过更轻松地编写可扩展和响应式应用程序来简化并发编程。
- Thread Pool :不需要显式管理线程池。 JVM 可以根据工作负载动态调整线程数量。
没有执行器的虚拟线程声明方式
public static void main(String[] args) {

    Thread virtualThread = Thread.ofVirtual().start(() -> {
        System.out.println("Virtual thread running");
    });

    System.out.println("Main thread running");

}
private static void main(String[] args) {

        Thread virtualThread = Thread.ofVirtual()
                .name("Virtual Thread")
                .unstarted(() ->System.out.println("Virtual thread running"));

        t.start();

        try {
            virtualThread.join();
        } catch (InterruptedException e) {
            e.printStackTrace();
        }

    }
Spring Boot 中的实现
Java Version: 20
Spring Version: 3.1.0
1) pom.xml
 <dependencies>

    <!--Web -->
    <dependency>
        <groupId>org.springframework.boot</groupId>
        <artifactId>spring-boot-starter-web</artifactId>
    </dependency>

    <dependency>
        <groupId>org.projectlombok</groupId>
        <artifactId>lombok</artifactId>
        <optional>true</optional>
    </dependency>

    <dependency>
        <groupId>org.springframework.boot</groupId>
        <artifactId>spring-boot-starter-test</artifactId>
        <scope>test</scope>
    </dependency>

    <!--Prometheus, Zipkin & Micrometer-->
    <dependency>
        <groupId>io.micrometer</groupId>
        <artifactId>micrometer-registry-prometheus</artifactId>
        <scope>runtime</scope>
        <version>1.11.0</version>
    </dependency>

    <dependency>
        <groupId>io.zipkin.reporter2</groupId>
        <artifactId>zipkin-reporter-brave</artifactId>
        <version>2.16.3</version>
    </dependency>

    <dependency>
        <groupId>io.micrometer</groupId>
        <artifactId>micrometer-tracing-bridge-brave</artifactId>
    </dependency>

    <!--Actuator & AOP-->
    <dependency>
        <groupId>org.springframework.boot</groupId>
        <artifactId>spring-boot-starter-actuator</artifactId>
        <version>3.1.0</version>
    </dependency>

    <dependency>
        <groupId>org.springframework.boot</groupId>
        <artifactId>spring-boot-starter-aop</artifactId>
    </dependency>

</dependencies>

<build>
    <plugins>
        <plugin>
            <groupId>org.springframework.boot</groupId>
            <artifactId>spring-boot-maven-plugin</artifactId>
            <configuration>
                <excludes>
                    <exclude>
                        <groupId>org.projectlombok</groupId>
                        <artifactId>lombok</artifactId>
                    </exclude>
                </excludes>
            </configuration>
        </plugin>

        <plugin>
            <groupId>org.apache.maven.plugins</groupId>
            <artifactId>maven-compiler-plugin</artifactId>
            <configuration>
                <source>20</source>
                <target>20</target>
                <compilerArgs>
                    --enable-preview
                </compilerArgs>
            </configuration>
        </plugin>

    </plugins>
</build>
必须确保有 Java 21 的 JVM 可用! (如果您运行的是 Java 19,则可以使用 --preview-enabled=true 运行虚拟线程。)
2) application.properties
spring.application.name=spring-vthread-service

management.zipkin.tracing.endpoint=http://${ZIPKIN_HOST:localhost}:9411/api/v2/spans
management.tracing.sampling.probability=1.0
management.endpoints.web.exposure.include=info,health,prometheus,metrics
server.tomcat.mbeanregistry.enabled=true
management.metrics.tags.application=${spring.application.name}

logging.pattern.level=%5p [${spring.application.name:},%X{traceId:-},%X{spanId:-}]
3)VThreadServiceApplication
1、创建100_000个传统Java线程并执行。
@SpringBootApplication
public class VThreadServiceApplication {

    public static void main(String[] args) {
        SpringApplication.run(VThreadServiceApplication.class, args);
    }

    @Bean
    public ApplicationRunner runner() {

        return args -> {
            var startDate = Instant.now();

            startThreads();

            var finishDate = Instant.now();
            System.out.println(String.format("Start Date: %s, Finish Date: %s", startDate, finishDate));
            System.out.println(String.format("Duration Time(Milliseconds): %s", Duration.between(startDate, finishDate).toMillis()));

        };
    }

    private void startThreads() throws InterruptedException {

        for (int i = 0; i < 100_000; i++) {
            int finalI = i;
            Thread t = new Thread(() -> System.out.println(finalI));
            t.start();
            t.join();
        }
    }

}
输出:
.
.
99998
99999
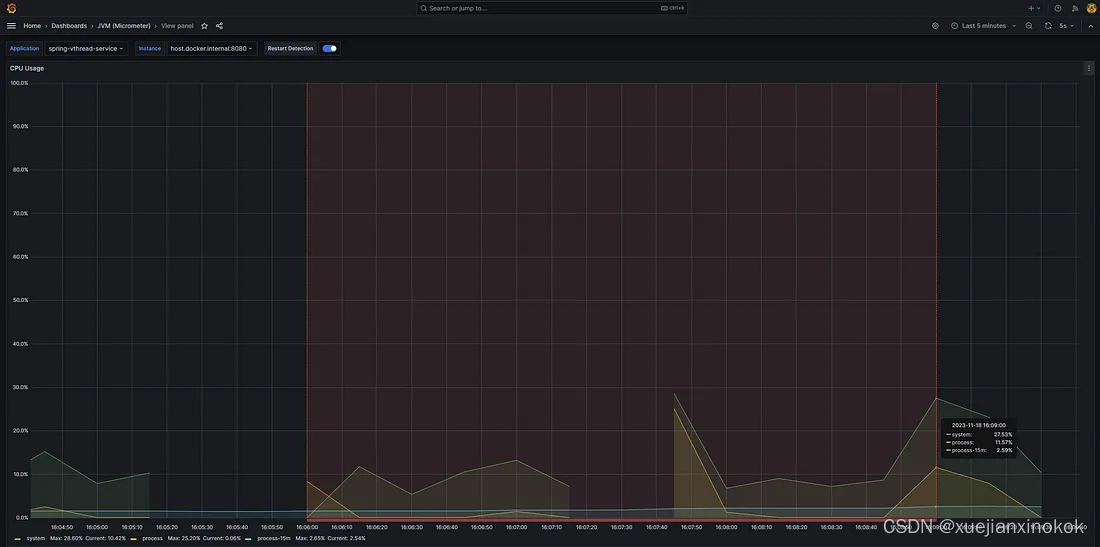
Start Date: 2023-11-18T12:20:09.491114200Z, Finish Date: 2023-11-18T12:20:28.139291800Z
Duration Time(Milliseconds): 18648
Duration Time(Milliseconds): 18648
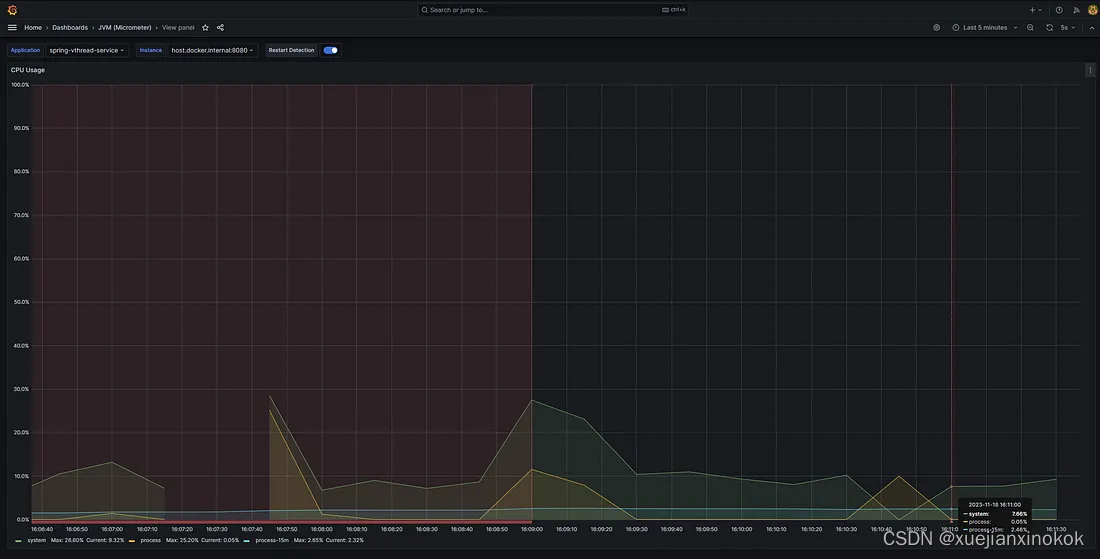
CPU使用率:
2.、创建100_000个虚拟Java线程并执行。
@SpringBootApplication
public class VThreadServiceApplication {

    public static void main(String[] args) {
        SpringApplication.run(VThreadServiceApplication.class, args);
    }

    @Bean
    public ApplicationRunner runner() {

        return args -> {
            var startDate = Instant.now();

            startVirtualThreads();

            var finishDate = Instant.now();
            System.out.println(String.format("Start Date: %s, Finish Date: %s", startDate, finishDate));
            System.out.println(String.format("Duration Time(Milliseconds): %s", Duration.between(startDate, finishDate).toMillis()));

        };
    }

    private void startVirtualThreads() throws InterruptedException {

        for (int i = 0; i < 100_000; i++) {
            int finalI = i;
            Thread t = Thread.ofVirtual()
                    .name(String.format("virtualThread-%s", i))
                    .unstarted(() -> System.out.println(finalI));
            t.start();
            t.join();

        }
    }

}
输出:
.
  .
99998
99999
Start Date: 2023-11-18T12:22:14.838308900Z, Finish Date: 2023-11-18T12:22:18.588181800Z
Duration Time(Milliseconds): 3749
Duration Time(Milliseconds): 3749
CPU使用率:
3. 创建Http控制器
@RestController
@RequestMapping("/api/v1/threads")
@Slf4j
public class ThreadController {

    @GetMapping("")
    public String thread() throws InterruptedException {
        Thread.sleep(1000);
        var threadName = Thread.currentThread().toString();
        log.info(threadName);
        return "thread executed";
    }

}
3.1 发送HTTP请求(传统线程)
发送 1600 请求。
并发请求数:400
命令
ab -n 1600 -c 400 host.docker.internal:8080/api/v1/threads
Response Summary
This is ApacheBench, Version 2.3 <$Revision: 1879490 $>
Copyright 1996 Adam Twiss, Zeus Technology Ltd, http://www.zeustech.net/
Licensed to The Apache Software Foundation, http://www.apache.org/

Benchmarking host.docker.internal (be patient)
Completed 160 requests
Completed 320 requests
Completed 480 requests
Completed 640 requests
Completed 800 requests
Completed 960 requests
Completed 1120 requests
Completed 1280 requests
Completed 1440 requests
Completed 1600 requests
Finished 1600 requests


Server Software:
Server Hostname:        host.docker.internal
Server Port:            8080

Document Path:          /api/v1/threads
Document Length:        15 bytes

Concurrency Level:      400
Time taken for tests:   9.659 seconds
Complete requests:      1600
Failed requests:        0
Total transferred:      236800 bytes
HTML transferred:       24000 bytes
Requests per second:    165.65 [#/sec] (mean)
Time per request:       2414.722 [ms] (mean)
Time per request:       6.037 [ms] (mean, across all concurrent requests)
Transfer rate:          23.94 [Kbytes/sec] received

Connection Times (ms)
              min  mean[+/-sd] median   max
Connect:        2  127  51.4    118     375
Processing:  1040 1877 258.2   1905    2438
Waiting:     1010 1755 257.0   1781    2304
Total:       1042 2004 268.9   2019    2660

Percentage of the requests served within a certain time (ms)
  50%   2019
  66%   2032
  75%   2041
  80%   2048
  90%   2540
  95%   2603
  98%   2638
  99%   2650
 100%   2660 (longest request)
Time taken for tests :9.659 秒
3.2发送HTTP请求(虚拟线程)
创建线程执行器
线程执行器配置
@Configuration
@Slf4j
public class ThreadExecutorConfig {

    @Bean
    public TomcatProtocolHandlerCustomizer<?> protocolHandlerVirtualThreadExecutorCustomizer() {
        return protocolHandler -> {
            log.info("Configuring " + protocolHandler + " to use VirtualThreadPerTaskExecutor");
            protocolHandler.setExecutor(Executors.newVirtualThreadPerTaskExecutor());
        };
    }

}
发送 1600 请求。
并发请求数:400
Command 命令
ab -n 1600 -c 400 host.docker.internal:8080/api/v1/threads
Response Summary
This is ApacheBench, Version 2.3 <$Revision: 1879490 $>
Copyright 1996 Adam Twiss, Zeus Technology Ltd, http://www.zeustech.net/
Licensed to The Apache Software Foundation, http://www.apache.org/

Benchmarking host.docker.internal (be patient)
Completed 160 requests
Completed 320 requests
Completed 480 requests
Completed 640 requests
Completed 800 requests
Completed 960 requests
Completed 1120 requests
Completed 1280 requests
Completed 1440 requests
Completed 1600 requests
Finished 1600 requests


Server Software:
Server Hostname:        host.docker.internal
Server Port:            8080

Document Path:          /api/v1/threads
Document Length:        0 bytes

Concurrency Level:      400
Time taken for tests:   7.912 seconds
Complete requests:      1600
Failed requests:        0
Total transferred:      211200 bytes
HTML transferred:       0 bytes
Requests per second:    202.22 [#/sec] (mean)
Time per request:       1978.077 [ms] (mean)
Time per request:       4.945 [ms] (mean, across all concurrent requests)
Transfer rate:          26.07 [Kbytes/sec] received

Connection Times (ms)
              min  mean[+/-sd] median   max
Connect:        1  186  89.6    197     337
Processing:  1005 1376 251.1   1423    1855
Waiting:     1005 1198 158.2   1171    1591
Total:       1040 1562 244.2   1612    2060

Percentage of the requests served within a certain time (ms)
  50%   1612
  66%   1668
  75%   1691
  80%   1724
  90%   1903
  95%   1997
  98%   2037
  99%   2048
 100%   2060 (longest request)
Time taken for tests :7.912 秒
相关文档:
文章来源:https://blog.csdn.net/xuejianxinokok/article/details/135061646
本文来自互联网用户投稿,该文观点仅代表作者本人,不代表本站立场。本站仅提供信息存储空间服务,不拥有所有权,不承担相关法律责任。 如若内容造成侵权/违法违规/事实不符,请联系我的编程经验分享网邮箱:chenni525@qq.com进行投诉反馈,一经查实,立即删除!
本文来自互联网用户投稿,该文观点仅代表作者本人,不代表本站立场。本站仅提供信息存储空间服务,不拥有所有权,不承担相关法律责任。 如若内容造成侵权/违法违规/事实不符,请联系我的编程经验分享网邮箱:chenni525@qq.com进行投诉反馈,一经查实,立即删除!
最新文章
- Python教程
- 深入理解 MySQL 中的 HAVING 关键字和聚合函数
- Qt之QChar编码(1)
- MyBatis入门基础篇
- 用Python脚本实现FFmpeg批量转换
- python实现Ethernet/IP协议的客户端(一)
- 蜣螂优化算法DBO预告
- 企业微信营销工具:重塑营销格局,引领商业新潮流
- 计算样本距离常见的集中度量方法
- 【响应式编程-02】Lambda的语法格式和使用
- Transformer热门魔改方案汇总!大大提升模型速度与效果!
- KUKA机器人BASE/TCP/程序模板导入
- Git三种方法从远程仓库拉取指定分支
- docker-compose单机容器编排
- CSS5 | CSS滑动门左扇与右扇图片重叠问题解决