Excel报表框架(ExcelReport)极简化解决复杂报表导出问题
Excel Report
耗费了半个月的时间,终于在元旦这三天把报表框架开发完成了,使用该框架你可以非常方便的导出复杂的Excel报表。
项目开源地址:
前言
不知道各位在使用POI开发报表导出过程中遇到过以下的情况:
- 频繁的使用中间变量记录报表数据写到那个Cell中了。
- 一个复杂的报表往往至少要几百行、甚至是上千行的代码。
- POI的api非常难用,设置一个值甚至绘制一个图形要调用好多类
- 为Cell设置Style非常麻烦,还得时时担心style数量会不会超过excel的最大限制
- merge Cell的时候提心吊胆的,得谨慎小心的计算应该merge的cell范围
等等等等,上面的这些内容我估计频繁开发复杂报表的同学应该非常熟悉,这些还不是最痛苦的,最痛苦的是遇到那种报表修改的情况,假如某一个地方要加一列,某个地方要合并一个列,就必须把这成百上千的代码逻辑再次梳理一遍,因为所有的cell位置都是相关的,加了一列就必须把相关的cell位置也更新才可以。
复杂报表框架 Excel-Report
鉴于上面这种复杂报表的导出问题,花了半个月的时间,开发了一个复杂报表导出框架。它可以让我们像设计UI界面那样简单。
框架的特点:
- 几乎完全屏蔽POI操作,提供类UI框架的操作接口、定义报表非常简单
- 提供模板文件定义,类似于各种模板框架,支持SPEL表达式的模板定义
- 提供类似于 Themleaf 的 If, For 标签,更方便定义模板
- 自动计算组件位置
- 简化CellStyle设置
- 支持各种不同类型的组件(例如Text,List、Image,Link、Table、Chart…)
适合做什么
- 比较复杂的各种嵌套的报表
- 经常有可能会变化的报表
- 单元格样式比较多的报表
不适合做什么
- 大数据量的数据导出
因为该框架是基于模板的报表生成框架,也就意味着要想让表达式工作就需要把数据加载到内存中才可以,所以大数据量的数据导出不适合用这个框架去做。 - 非常简单的报表
比如一个报表可能就一个table,一个list,这种方式用框架反而可能适得其反,阿里的easyexcel导出这类的报表更简单。
下面看看使用这个框架之后将会怎么简化报表的导出:
引入依赖
<dependency>
    <groupId>io.github.mengfly</groupId>
    <artifactId>excel-report</artifactId>
    <version>1.0.0</version>
</dependency>
定义报表组件(Java代码方式)
框架提供了类似的UI编程的方式,如果大家有接触过UI框架,那么对这些操作应该比较熟悉。
// 垂直布局
VLayout layout = new VLayout();

layout.addItem(new TextComponent(new Size(10, 5), "Test(width=10, height=5)"));
// 添加一个横向布局
final HLayout hLayout = layout.addItem(new HLayout());

final TextComponent item = new TextComponent(new Size(3, 1), "Test(width=3)");
// 设置样式
item.addStyle(CellStyles.fontColor, CellStyles.createColor(0xff0000));
item.addStyle(CellStyles.fontBold, true);
item.addStyle(CellStyles.fontName, "楷体");

hLayout.addItem(item);
hLayout.addItem(new TextComponent(new Size(5, 1), "Test(width=5)"));
这样就定义好了一个非常简单的组件。
下面可以通过一下代码导出excel
ExcelReport report = new ExcelReport();
report.exportSheet("sheet1", layout, SheetStyles.DEFAULT_STYLE);
report.save(new File("test.xlsx");
这样就生成了一个自定义布局的Excel。

定义报表组件(模板方式、推荐)
定义模板
首先编辑一个报表模板,只需要引入对应的命名空间就会有输入提示,如下:
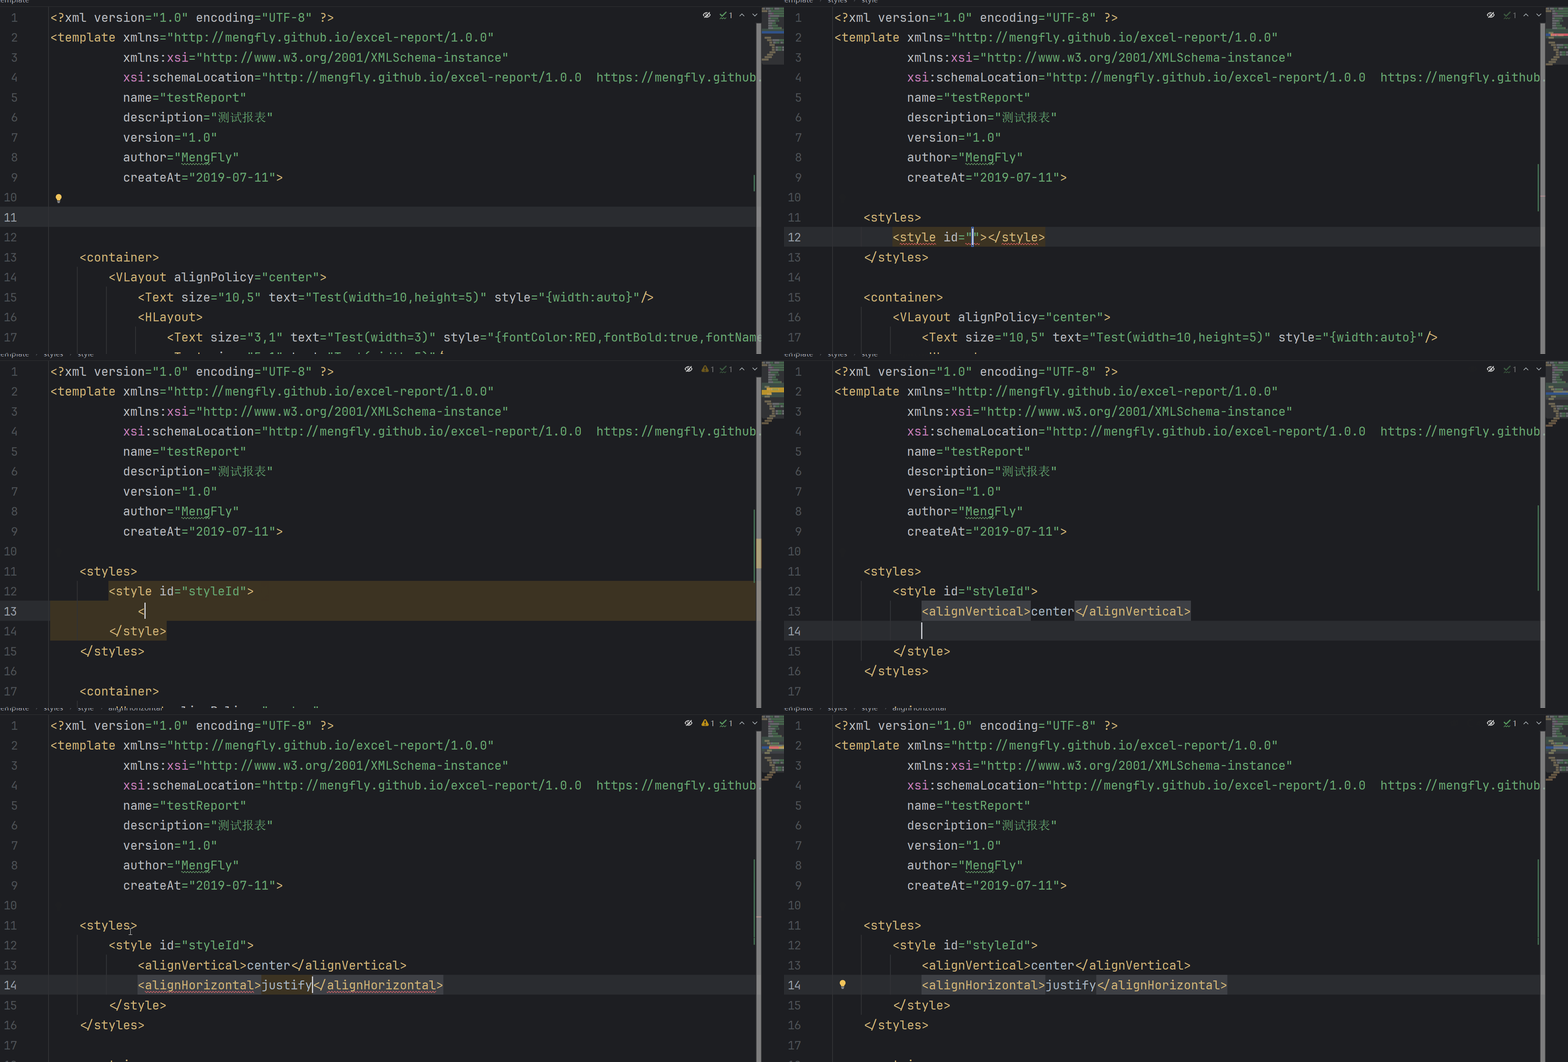
以下为实例:
具体的模板实例可以参考:模板文件
<?xml version="1.0" encoding="UTF-8" ?>
<template
        xmlns="http://mengfly.github.io/excel-report/1.0.0"
        xmlns:xsi="http://www.w3.org/2001/XMLSchema-instance"
        xsi:schemaLocation="http://mengfly.github.io/excel-report/1.0.0 https://mengfly.github.io/xsd/excel-report-1.0.0.xsd"
        name="testImage"
        description="测试模板"
        version="1.0"
        author="MengFly"
        createAt="2023-12-26">

    <!--  定义模板参数,该参数无特殊意义,只是为了统一放在这里方便对模板内的参数统一展示,方便了解模板参数数据  -->
    <parameters>
        <parameter id="parameter" name="参数名称"/>
    </parameters>

    <!--  Sheet 页参数,一个模板文件对应一个sheet页  -->
    <sheetStyle>
        <autobreaks>true</autobreaks>
        <!--    ...    -->
    </sheetStyle>

    <styles>
        <!--    定义Cell样式表,可以在下面的组件中引用    -->
        <style id="testStyle">

        </style>

        <style id="testStyle2">

        </style>
    </styles>

    <!--  编写模板结构,使用表达式传递数据   -->
    <container>
        <VLayout style="testStyle testStyle2">
            <HLayout style="{width:auto}">
                <Text text="${value}"/>
            </HLayout>
        </VLayout>
    </container>
</template>
传递参数,渲染模板
import io.github.mengfly.excel.report.excel.ExcelReport;

public static void main(String[] args) {
    // 创建报表类
    ExcelReport report = new ExcelReport();

    // 构建数据参数
    DataContext context = new DataContext();
    context.put("image", TestDataUtil.getTestImageFile());
    context.put("tableData", TestDataUtil.getData(10));
    context.put("listData", TestDataUtil.getRandomStringList(9));
    // ...

    try (InputStream stream = getClass().getClassLoader().getResourceAsStream("TestTemplate.xml")) {
        // 加载模板
        ReportTemplate template = new ReportTemplate(stream);

        // 导出模板到Sheet页, 一个ExcelReport 代表了一个Excel文件,每次调用export就是在向里面添加一个Sheet页
        report.exportTemplate(template, FileUtil.mainName(templatePath), context);
    }

    // 存储文件
    report.save(new File("test-template.xlsx"));
}
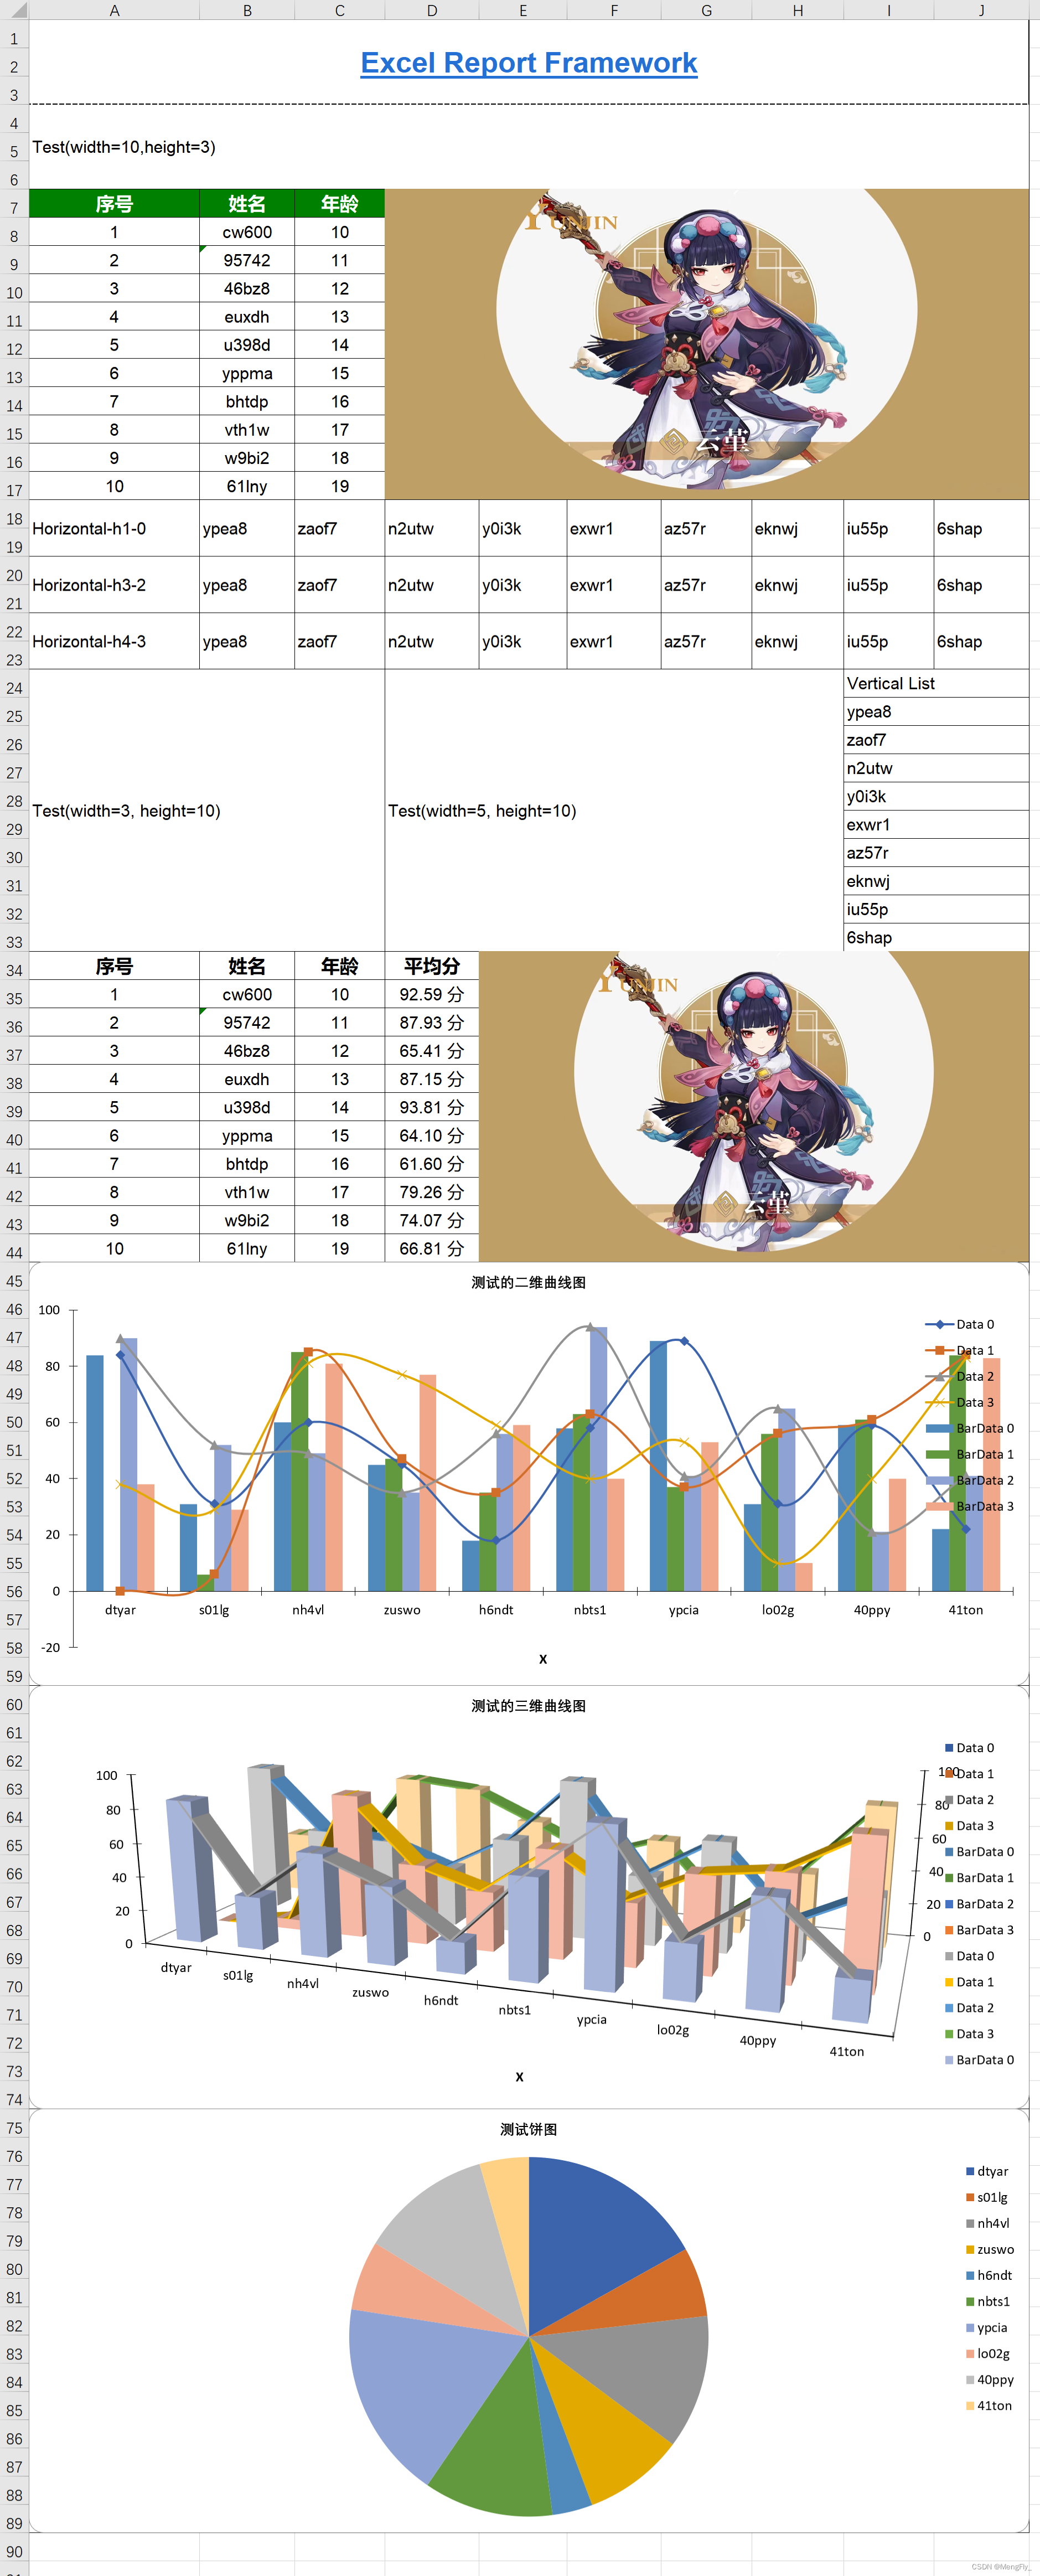
最终结果
应用示例
我在网上随便找了一个国家统计年鉴的数据表格,我们以这个表格为例,说明一下怎么使用该框架复现这么一个报表。
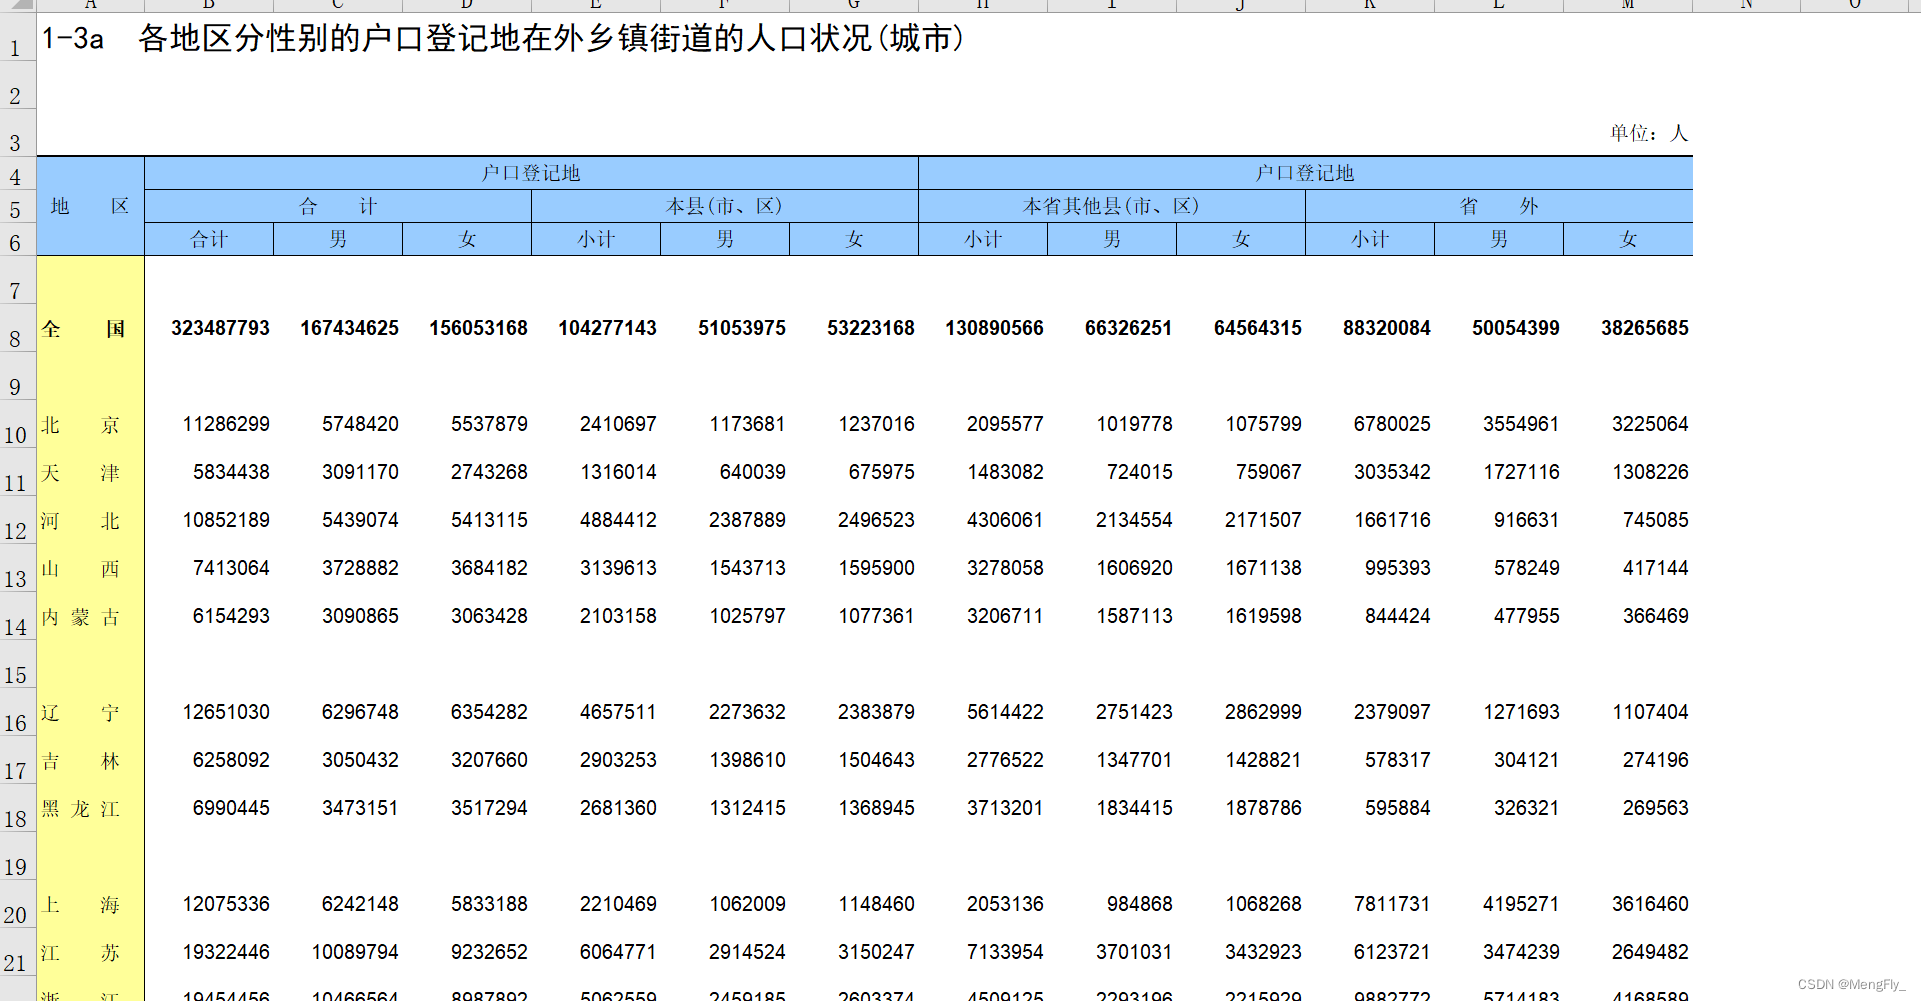
1. 分析报表结构
首先可以看到,这张报表其实分为几个部分:
- 最上面的Header部分
包括一个大的文档标题,右下角有一个单位:人的字样 - 中间的表头
这个表头是一个固定的表头,可以非常简单Text罗列出来 - 下方的数据项
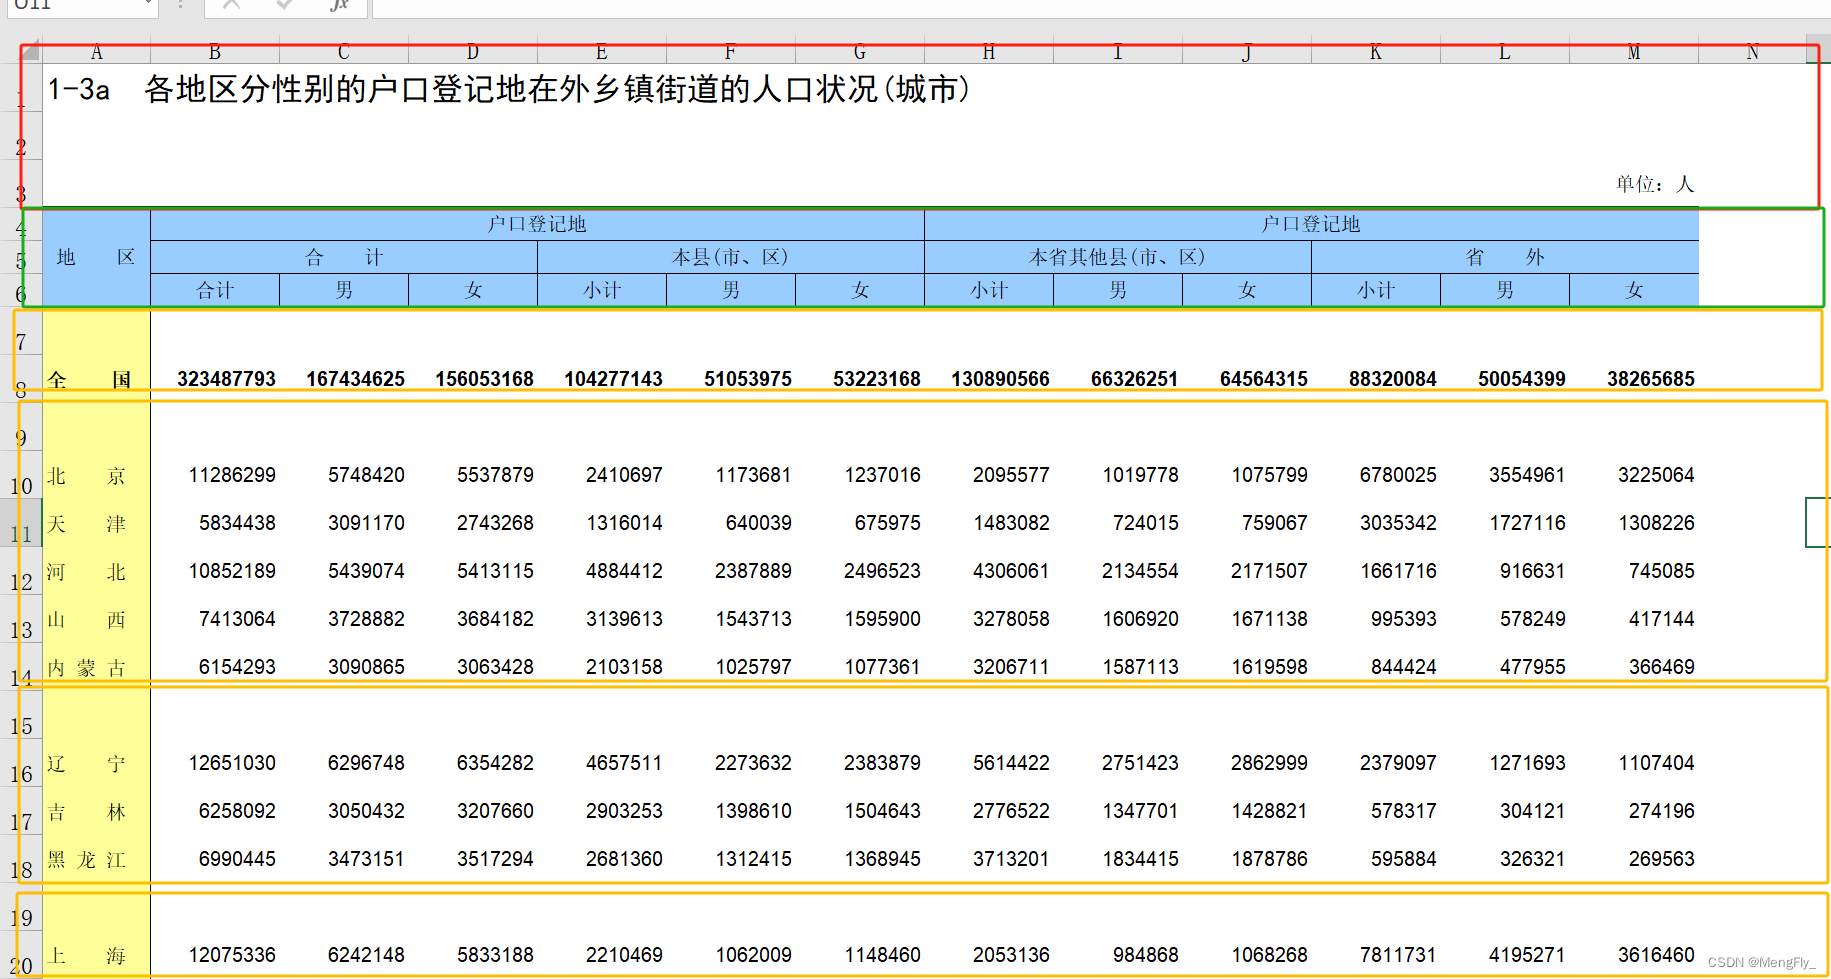
很明显这个数据项是分组的,可以看成一个空行+一组数据,然后下面是类似的结构,比如全国是一组,北京、天津、河北、山西、内蒙古是一组。
报表结构如下:
2. 定义模板
了解了报表的结构之后就可以定义模板了,我们一步一步定义
0. 顶级布局
首先,这里的所有部分是一个垂直排布的,所以顶级布局我们选择VLayout
 <VLayout>

 </VLayout>
1. 红色部分
红色部分其实是由两部分组成的,上面一个大字体,站13列一行,
下面一个小字体,站13列2行, 而且可以看到的是,下方的单元格边框为粗线、深绿色,因此我们定义他们的样式
   <!--无框线的样式-->
   <style id="noBorder">
       <width>auto</width>
       <alignHorizontal>center</alignHorizontal>
       <borderBottom>none</borderBottom>
       <borderRight>none</borderRight>
       <borderLeft>none</borderLeft>
       <borderTop>none</borderTop>
   </style>

 	<!--文字位置在右上角, 字体大小18-->
   <style id="headerStyle">
       <fontHeight>18</fontHeight>
       <fontBold>true</fontBold>

       <alignVertical>top</alignVertical>
   </style>

  <Text size="13,1" style="headerStyle noBorder"
        text="1-3a  各地区分性别的户口登记地在外乡镇街道的人口状况(城市)"/>

  <Text size="13,2" style="tagStyle" text="单位:人"/>
2. 绿色部分
绿色部分就是一个简单的HLayout和Vlayout组合的表头,背景颜色淡蓝色,有边框。
  <style id="headerBackground">
       <fillForegroundColor>#99CCFF</fillForegroundColor>
       <alignHorizontal>center</alignHorizontal>
   </style>

  <HLayout style="headerBackground">
      <Text size="1,3" text="地区"/>
      <VLayout>
          <Text size="6,1" text="户口登记地"/>
          <HLayout>
              <Text size="3,1" text="合计"/>
              <Text size="3,1" text="本县(市、区)"/>
          </HLayout>
          <HLayout>
              <Text text="合计"/>
              <Text text="男"/>
              <Text text="女"/>
              <Text text="小计"/>
              <Text text="男"/>
              <Text text="女"/>
          </HLayout>
      </VLayout>
      <VLayout>
          <Text size="6,1" text="户口登记地"/>
          <HLayout>
              <Text size="3,1" text="本省其他县(市、区)"/>
              <Text size="3,1" text="省    外"/>
          </HLayout>
          <HLayout>
              <Text text="小计"/>
              <Text text="男"/>
              <Text text="女"/>
              <Text text="小计"/>
              <Text text="男"/>
              <Text text="女"/>
          </HLayout>
      </VLayout>
  </HLayout>
3. 黄色部分
黄色部分复杂一些,我们需要使用变量表达式完成,黄色部分每一部分其实都是两个部分组成的。
上方是一个空白行,下方是一个table。我们使用下面的方式定义。
<!--第一列的style,背景颜色淡黄色、右边框-->
 <style id="nameCellStyle">
       <fillForegroundColor>#FFFF99</fillForegroundColor>
       <borderTop>none</borderTop>
       <borderRight>thin</borderRight>
       <borderBottom>none</borderBottom>
       <borderLeft>none</borderLeft>
       <alignHorizontal>distributed</alignHorizontal>
   </style>
<!--使用SPEL表达式, 遍历分组数据-->
<VLayout style="noBorder" for="item,index: ${data}">
		<!--空白行,第一列淡蓝色-->
         <HLayout>
             <Text style="nameCellStyle" text=""/>
             <Text text="" size="12,1"/>
         </HLayout>

		 <!--table数据,不显示header, 并且在第一组数据的时候字体加粗,也就是全国那个数据-->
         <Table dataList="${item}" headerVisible="false" style="{fontBold:'${index==0?true:false}'}">
             <column id="name" name="地区" dataStyle="nameCellStyle"/>
             <column id="all.sum" name="合计"/>
             <column id="all.man" name="男"/>
             <column id="all.women" name="女"/>
             <column id="local.sum" name="合计"/>
             <column id="local.man" name="男"/>
             <column id="local.women" name="女"/>
             <column id="localOther.sum" name="合计"/>
             <column id="localOther.man" name="男"/>
             <column id="localOther.women" name="女"/>
             <column id="other.sum" name="合计"/>
             <column id="other.man" name="男"/>
             <column id="other.women" name="女"/>
         </Table>

     </VLayout>
这样一个完整的报表模板就定义完了。
完整的模板文件地址: https://gitee.com/mengfly_p/excel-report/blob/master/src/test/resources/Example1Template.xml
3. 渲染数据
其实可以看到,模板中定义的变量一定是要和渲染的数据结构一一对应的,这其中的原理和 thymeleaf 一样,他们都是通过表达式取的数据。
我们的数据,也是按照数据组进行组织的,如下:
	// 数据组
    List<List<DataStat>> dataGroup;

	/**
	 * 单行数据
	 */
    private static class DataStat {
        private String name;
        private DataItem all;
        private DataItem local;
        private DataItem localOther;
        private DataItem other;
   }
   /**
    * 小数据项
    */
   public static class DataItem {
        private Long sum;
        private Long man;
        private Long women;
   }
接下来,我用模拟数据来进行数据的渲染
    public static List<List<DataStat>> getData() {
        List<List<DataStat>> province = new ArrayList<>();
        province.add(Collections.singletonList(DataStat.createRandom("all")));
        for (int i = 0; i < 5; i++) {
            List<DataStat> stats = new ArrayList<>();
            for (int i1 = 0; i1 < RandomUtil.randomInt(3, 8); i1++) {
                stats.add(DataStat.createRandom("XXX"));
            }
            province.add(stats);
        }
        return province;
    }

    public static void main(String[] args) throws IOException {


        DataContext context = new DataContext();
        // 设置数据
        context.put("data", Example1.getData());

        ExcelReport report = new ExcelReport();

        try (final InputStream resourceAsStream = Example1.class.getClassLoader().getResourceAsStream("Example1Template.xml")) {
        	// 加载模板
            ReportTemplate template = new ReportTemplate(resourceAsStream);

			// 渲染数据
            report.exportTemplate(template, null, context);
        }
        report.save(new File("example1.xlsx"));
    }
4. 最终结果
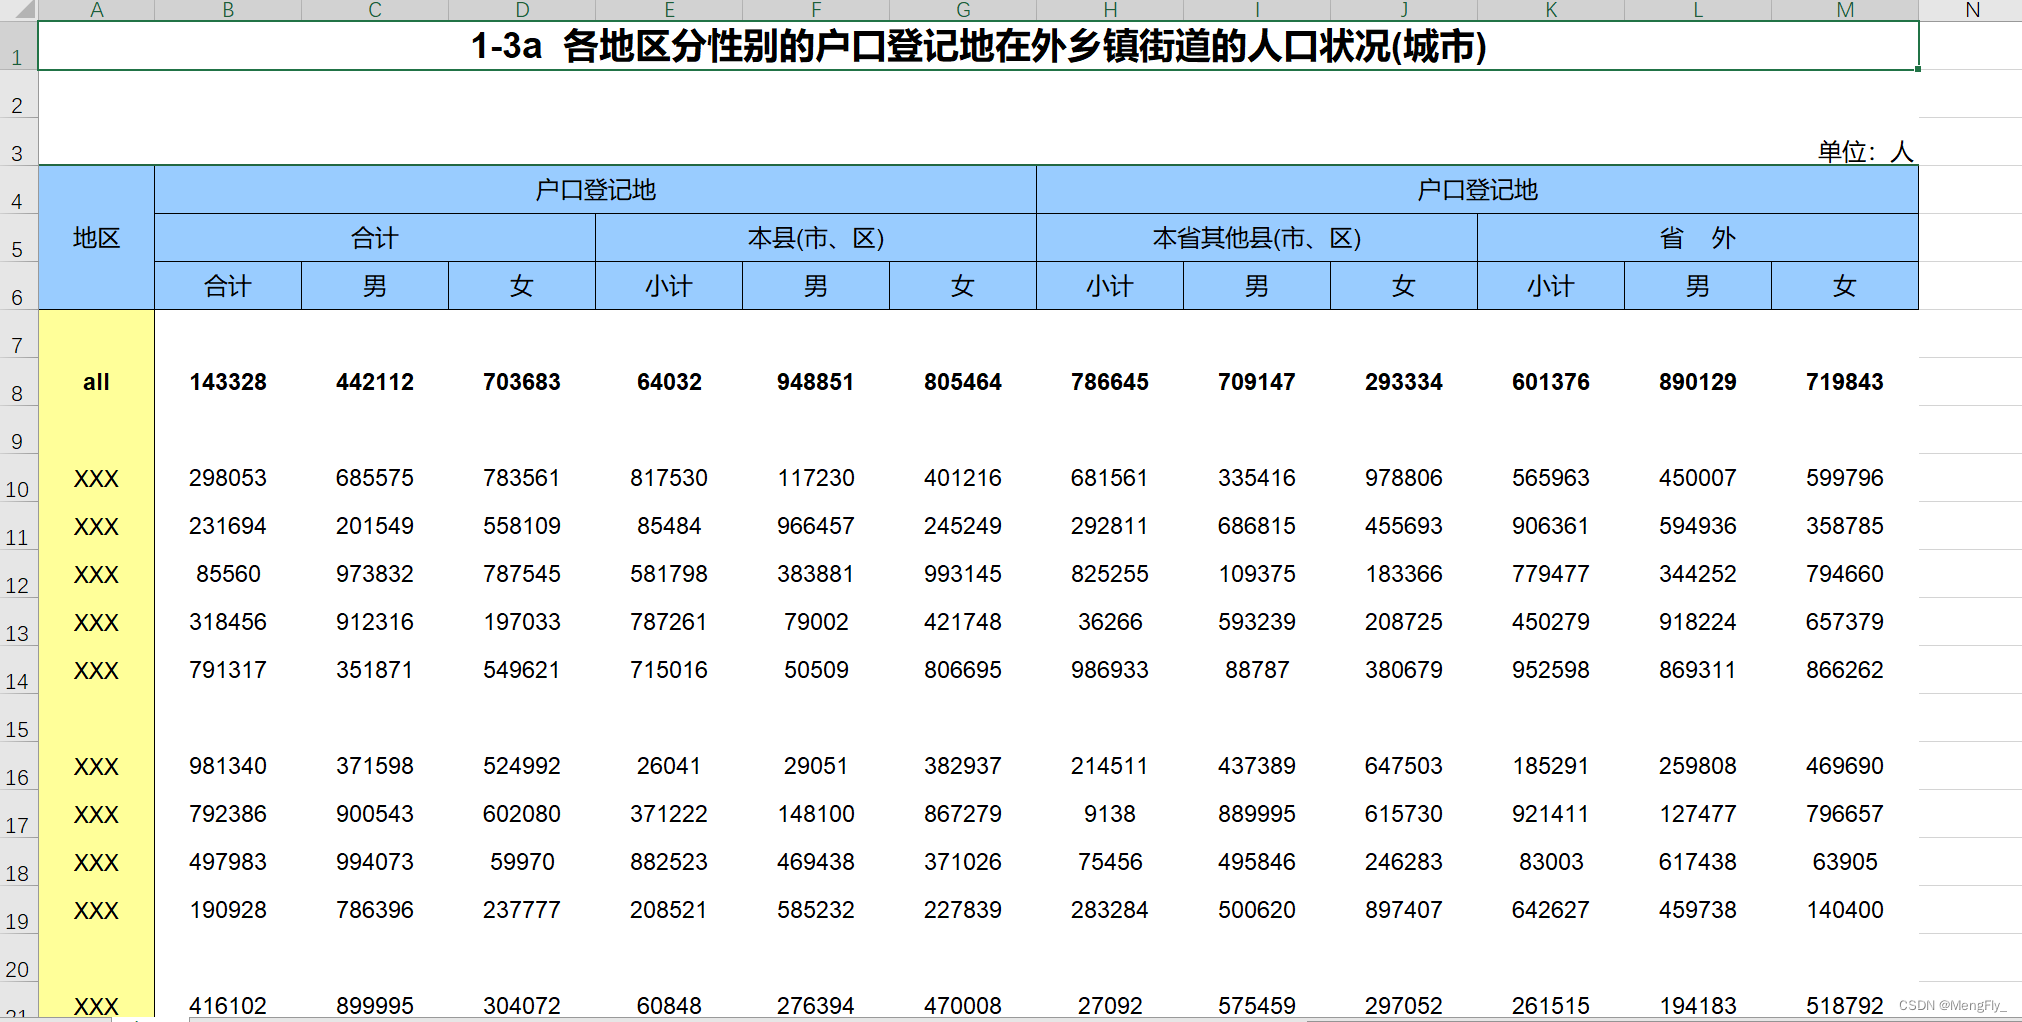
可以看到几乎已经和原来的报表非常相似了。而且如果以后需要调整的话,只需要调整模板就可以。
本文来自互联网用户投稿,该文观点仅代表作者本人,不代表本站立场。本站仅提供信息存储空间服务,不拥有所有权,不承担相关法律责任。 如若内容造成侵权/违法违规/事实不符,请联系我的编程经验分享网邮箱:chenni525@qq.com进行投诉反馈,一经查实,立即删除!
- Python教程
- 深入理解 MySQL 中的 HAVING 关键字和聚合函数
- Qt之QChar编码(1)
- MyBatis入门基础篇
- 用Python脚本实现FFmpeg批量转换
- 信贷风控新纪元:行为评分建模的魅力和挑战
- git 初始化的一些操作
- OpenCvSharp 通道拆分、空间转换
- C++初阶-反向迭代器的模拟实现
- 道本合规管里||跨越法律工作瓶颈,提升合规风控能力的关键措施
- 230.【2023年华为OD机试真题(C卷)】转盘寿司(Java&Python&C++&JS实现)
- 38-WEB漏洞-反序列化之PHP&JAVA全解(下)
- GB/T 28886-2012 建筑用塑料门检测
- 计算机为什么有趣?哪些地方有趣?为什么学习四则运算简单,学习微积分却很难?导数是微分吗?
- Eureka一篇就够了