【Python代码】以线性模型为例,详解深度学习算法流程,包括数据生成、定义模型、损失函数、优化算法和训练
**使用带有噪声的线性模型构造数据集,并根据有限的数据恢复该线性模型的参数。**其中包括数据集构造、模型参数初始化、损失函数定义、定义优化算法和训练等过程。是大多数算法实现过程的一个缩影,理解此过程有助于在开发或改进算法时更深刻了解其算法的构造和框架。
过程详解
生成数据
此时以简单的线性模型为例,生成1000个2维的数据,作为样本集。每个样本都符合均值为0,标准差为1的正态分布。具体代码如下所示。
import torch

def synthetic_data(w,b,num_examples):
    """生成y=Wx+b+噪声"""
    ##X是一个1000行2列的数据,符合0,1的正态分布
    X=torch.normal(0,1,(num_examples,len(w)))#特征
    y=torch.matmul(X,w)+b
    y+=torch.normal(0,0.01,y.shape)#添加噪声
    return X,y.reshape((-1,1))
true_w=torch.tensor([2,-3.4])
true_b=4.2
features,labels=synthetic_data(true_w,true_b,1000)
print()
print('features',features[0],'\nlabels:',labels[0])
print('features.shape',features.shape,'\nlabels.shape:',labels.shape)
输出:
features tensor([0.1724, 0.8911])
labels: tensor([1.5308])
features.shape torch.Size([1000, 2])
labels.shape: torch.Size([1000, 1])
可以看出,已经生成了1000个2维的样本集X,大小为1000行2列。添加完噪声的标签labels,为1000行1列,即一个样本对应一个标签。
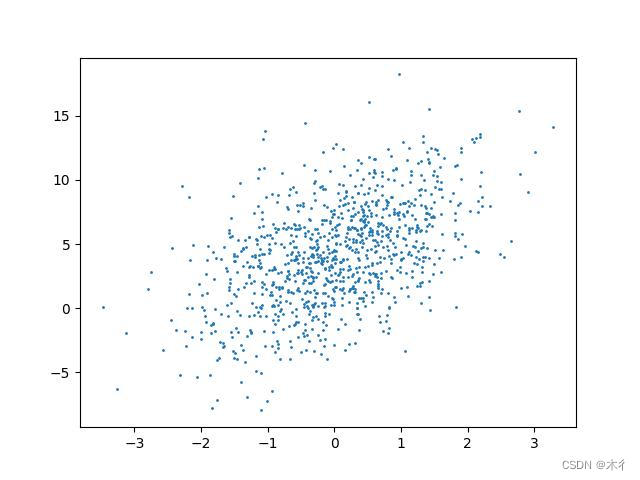
对生成数据的第一维和标签的结果可视化:
import matplotlib.pyplot as plt
plt.scatter(features[:,0].detach().numpy(),labels.detach().numpy(),1)
plt.savefig('x1000.jpg')
plt.show()

小批量划分数据集
把生成的数据打乱,并根据设置的批量大小,根据索引提取样本和标签。
def data_iter(batch_size,features,labels):
    num_examples=len(features)
    indices=list(range(num_examples))
    ##这些样本是随机读取的,没有特定顺序
    random.shuffle(indices)
    for i in range(0,num_examples,batch_size):
        batch_indices=torch.tensor(
        indices[i:min(i+batch_size,num_examples)]
        )#确定索引
        ##根据索引值提取相应的特征和标签
        yield features[batch_indices],labels[batch_indices]
选择其中的一个批量样本和标签可视化进行展示。
batch_size=10#批量设置为10
for X,y in data_iter(batch_size,features,labels):
    print(X,'\n',y)
    break##读取一次就退出,即选择其中的一个批量
输出:
tensor([[-0.6141, -0.9904],
        [ 2.2592, -1.2401],
        [ 0.3217, -2.0419],
        [ 2.6761,  1.6293],
        [-0.3886,  1.4958],
        [-1.4074,  0.2157],
        [-1.9986, -0.1091],
        [ 0.3808,  0.3756],
        [-0.6877,  0.3499],
        [ 1.5450, -1.0313]])
 tensor([[ 6.3528],
        [12.9585],
        [11.7972],
        [ 4.0089],
        [-1.6630],
        [ 0.6698],
        [ 0.5591],
        [ 3.6852],
        [ 1.6348],
        [10.7883]])
样本是10个1行2列的数据,标签是10个1行1列的数据。
模型参数初始化
这里设置权重w为符合均值为0,标准差为0.01的正态分布的随机生成数据,偏置b设置为0。也可以根据自己情况设置初始参数。
w=torch.normal(0,0.01,size=(2,1),requires_grad=True)
b=torch.zeros(1,requires_grad=True)
输出:
w: tensor([[-0.0164],
        [-0.0022]], requires_grad=True)
b: tensor([0.], requires_grad=True)
初始参数设置之后,接下来就是更新这些参数,直到这些参数满足我们的数据拟合。
在更新时,需要计算损失函数关于参数的梯度,再根据梯度向减小损失的方向更新参数。
模型定义
定义一个模型,将输入和输出关联起来。前面生成的数据是线性的,所以定义的模型也是一个线性的 y=Wx+b。
def linreg(X,w,b):
    """线性回归模型"""
    return torch.matmul(X,w)+b
损失函数定义
这里简单的定义一个损失函数,计算预测结果和真实结果的平均平方差。
def squared_loss(y_hat,y):
    """均方损失"""
    return (y_hat-y.reshape(y_hat.shape))**2/2
定义优化算法
使用小批量随机梯度下降算法作为优化算法。这里要确定超参数批量大小和学习率。
def sgd(params,lr,batch_size):
    """小批量随机梯度下降优化法"""
    with torch.no_grad():
        for param in params:
            param-=lr*param.grad/batch_size
            param.grad.zero_()
模型训练
有了数据、损失函数、初始参数和优化算法,我们就可以开始训练,更新参数。
lr=0.01
num_epochs=10
net=linreg
loss=squared_loss

for epoch in range(num_epochs):
    for X,y in data_iter(batch_size,features,labels):
        y_pred=net(X,w,b)
        l=loss(y_pred,y)
        l.sum().backward()
        sgd([w,b],lr,batch_size)
    with torch.no_grad():
        train_l=loss(net(features,w,b),labels)#使用更新后的参数计算损失
运行示例
整体代码
import torch
import random

##生成数据
def synthetic_data(w,b,num_examples):
    """生成y=Wx+b+噪声"""
    ##X是一个1000行2列的数据,符合0,1的正态分布
    X=torch.normal(0,1,(num_examples,len(w)))
    y=torch.matmul(X,w)+b
    y+=torch.normal(0,0.01,y.shape)
    return X,y.reshape((-1,1))
#真实的权重和偏置
true_w=torch.tensor([2,-3.4])
true_b=4.2
##调用生成数据函数,生成数据
features,labels=synthetic_data(true_w,true_b,1000)
# print('features',features[0],'\nlabels:',labels[0])
# print('features.shape',features.shape,'\nlabels.shape:',labels.shape)

# import matplotlib.pyplot as plt
# #set_figsize()
# plt.scatter(features[:,0].detach().numpy(),labels.detach().numpy(),1)
# plt.savefig('x1000.jpg')
# plt.show()

##读取数据,根据设置的批量大小
def data_iter(batch_size,features,labels):
    num_examples=len(features)
    indices=list(range(num_examples))
    ##这些样本是随机读取的,没有特定顺序
    random.shuffle(indices)
    for i in range(0,num_examples,batch_size):
        batch_indices=torch.tensor(
        indices[i:min(i+batch_size,num_examples)]
        )
        yield features[batch_indices],labels[batch_indices]
batch_size=10
# for X,y in data_iter(batch_size,features,labels):
#     print(X,'\n',y)
#     break

##初始化参数
w=torch.normal(0,0.01,size=(2,1),requires_grad=True)
b=torch.zeros(1,requires_grad=True)

##定义模型、损失函数和优化算法
def linreg(X,w,b):
    """线性回归模型"""
    return torch.matmul(X,w)+b
def squared_loss(y_hat,y):
    """均方损失"""
    return (y_hat-y.reshape(y_hat.shape))**2/2

def sgd(params,lr,batch_size):
    """小批量随机梯度下降优化法"""
    with torch.no_grad():
        for param in params:
            param-=lr*param.grad/batch_size
            param.grad.zero_()
#设置参数
lr=0.01
num_epochs=10
net=linreg
loss=squared_loss
##开始训练
for epoch in range(num_epochs):
    for X,y in data_iter(batch_size,features,labels):
        y_pred=net(X,w,b)
        l=loss(y_pred,y)
        l.sum().backward()
        sgd([w,b],lr,batch_size)
    with torch.no_grad():
        train_l=loss(net(features,w,b),labels)#使用更新后的参数计算损失
        print('w:',w,'\nb',b)
        print(f'epoch{epoch+1},loss{float(train_l.mean()):f}')
输出结果:
w: tensor([[ 1.1745],
        [-2.1489]], requires_grad=True)
b tensor([2.6504], requires_grad=True)
epoch1,loss2.268522
w: tensor([[ 1.6670],
        [-2.9392]], requires_grad=True)
b tensor([3.6257], requires_grad=True)
epoch2,loss0.318115
w: tensor([[ 1.8670],
        [-3.2300]], requires_grad=True)
b tensor([3.9866], requires_grad=True)
epoch3,loss0.044844
w: tensor([[ 1.9472],
        [-3.3373]], requires_grad=True)
b tensor([4.1204], requires_grad=True)
epoch4,loss0.006389
w: tensor([[ 1.9793],
        [-3.3768]], requires_grad=True)
b tensor([4.1701], requires_grad=True)
epoch5,loss0.000951
w: tensor([[ 1.9920],
        [-3.3914]], requires_grad=True)
b tensor([4.1888], requires_grad=True)
epoch6,loss0.000178
w: tensor([[ 1.9970],
        [-3.3968]], requires_grad=True)
b tensor([4.1958], requires_grad=True)
epoch7,loss0.000069
w: tensor([[ 1.9991],
        [-3.3988]], requires_grad=True)
b tensor([4.1984], requires_grad=True)
epoch8,loss0.000053
w: tensor([[ 1.9997],
        [-3.3995]], requires_grad=True)
b tensor([4.1993], requires_grad=True)
epoch9,loss0.000051
w: tensor([[ 1.9999],
        [-3.3998]], requires_grad=True)
b tensor([4.1997], requires_grad=True)
epoch10,loss0.000051
示例中部分函数详解
此部分,对代码中的部分函数进行解释和说明,以帮助大家理解和使用。
torch.normal()
torch.normal 是 PyTorch 中的一个函数,用于从正态分布(也称为高斯分布)中生成随机数。返回一个与输入张量形状相同的张量,其中的元素是从均值为 mean,标准差为 std 的正态分布中随机采样的。
import torch

x = torch.normal(0, 1, (3, 3))
print(x)
输出:
tensor([[-1.5393,  0.2281,  1.2181],
        [ 0.7260, -1.4805,  0.5720],
        [ 0.0170, -0.9961, -0.2761]])
.backward()
在PyTorch中,a.backward() 是一个用于自动微分的方法。它通常用于计算一个张量(tensor)相对于其操作数(即输入和参数)的梯度。当你使用 PyTorch 的 autograd 模块时,可以通过调用 backward() 方法来自动计算梯度。
import torch

# 创建一个张量并设置requires_grad=True来跟踪其计算历史
a = torch.tensor([5.0], requires_grad=True)
print('a:',a)
# 定义一个简单的操作
b = a * 2

# 调用backward()来自动计算梯度
b.backward()

# 输出梯度
print(a.grad)
输出:
a: tensor([5.], requires_grad=True)
tensor([2.])
其中,requires_grad属性是为了使PyTorch跟踪张量的计算历史并自动计算梯度。
本文来自互联网用户投稿,该文观点仅代表作者本人,不代表本站立场。本站仅提供信息存储空间服务,不拥有所有权,不承担相关法律责任。 如若内容造成侵权/违法违规/事实不符,请联系我的编程经验分享网邮箱:chenni525@qq.com进行投诉反馈,一经查实,立即删除!
- Python教程
- 深入理解 MySQL 中的 HAVING 关键字和聚合函数
- Qt之QChar编码(1)
- MyBatis入门基础篇
- 用Python脚本实现FFmpeg批量转换
- 回顾基础--HTML篇
- 【编译原理】期末预习PPT后三章笔记+LL(1) II
- 计算机找不到msvcp120.dll的修复方法,总结五种可靠的方法
- Python——字符串的详细介绍
- YOLOv8改进 | 进阶实战篇 | 利用YOLOv8进行过线统计(可用于人 、车过线统计)
- iMessage群发系统的功能设计和代码应用!
- 『 C++ 』红黑树RBTree详解 ( 万字 )
- Walker S敲锣,人形机器人第一股优必选在港交所主板挂牌上市
- 目标检测YOLO实战应用案例100讲-基于深度学习的人脸红外与可见光图像融合(续)
- pygame学习(二)——绘制线条、圆、矩形等图案