【数学建模美赛M奖速成系列】数据可视化方法(一)
写在前面
最近开始更新一个新的系列科研绘图,在同一个竞赛下,大家都近乎相同的解题思路下。之所以能出现一等二等三等奖的区别很大部分都在于结果的可视化,为了能更好地帮助大家进行可视化,近期将专门推出一个可视化板块,推出各种好看实用的可视化图形。
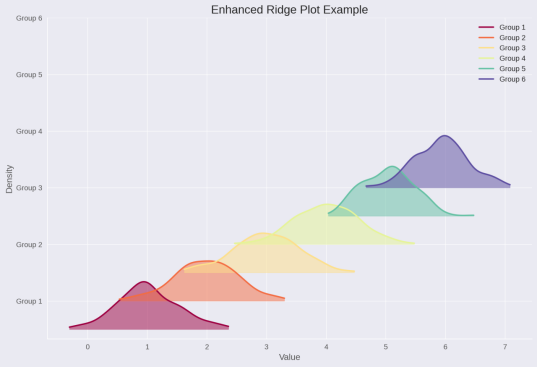
山脊图
也称为Joy Plot。它是一种数据可视化的方法,用于展示一个或多个组的数据分布。在山脊图中,每个组的数据分布通过平滑的密度曲线表示,这些曲线沿垂直轴堆叠排列,从而产生类似山脊的视觉效果。这种图表尤其适用于比较不同组的数据分布情况。
山脊图的制作基于核密度估计(Kernel Density Estimation, KDE),这是一种估计概率密度函数的非参数方式。与传统的条形图或直方图相比,山脊图提供了一种更平滑、更直观的方式来展示数据的分布情况。它特别适合于展示大量组的数据分布,可以帮助观察者理解不同组之间的差异和相似之处。
山脊图(Ridge Plot)是一种数据可视化工具,主要用于比较多个分布。
优点
- 比较能力:非常适合比较多个分布的形状和大小。它能清晰地展示不同组之间的变化和趋势。
- 空间效率:通过在单个图中堆叠,山脊图可以有效地利用空间,显示多组数据,避免了创建多个单独的密度图。
- 美观性:山脊图在视觉上吸引人,可以用不同的颜色和样式来区分不同的组,使得数据更加生动和直观。
- 趋势识别:可以轻松识别多个群体数据中的共同模式和异常值。
- 数据量:适用于展示大量数据集,而不会显得拥挤或不清晰。
缺点
- 过度拥挤:如果组的数量过多,山脊图可能会显得拥挤,使得个别分布难以辨认。
- 精确度:由于重叠,难以精确读取特定点的值,尤其是在分布之间的重叠区域。
- 数值比较:虽然能够展示分布趋势,但不适合精确比较不同组之间的数值。
- 边缘效应:在堆叠的密度图中,可能会产生误导,例如,边缘的分布可能看起来比实际更少。
实现
本次更新主要以matlab为主,python实现代码也放于文末展示
matlab
首先是,绘制最初始的,最简单的山脊图,如下所示

% 清空环境变量和窗口
clear; close all;

% 生成模拟数据
data = [];
groups = 6;
for i = 1:groups
data = [data; normrnd(i, 0.5, [200, 1])];
end

% 为每组数据创建一个标签
group = repelem(1:groups, 200)';

% 创建一个图形窗口
figure;

% 对每组数据进行绘制
for i = 1:groups
% 选择当前组的数据
subset = data(group == i);
% 计算核密度估计
[f, xi] = ksdensity(subset);
% 绘制密度曲线,并上移相应的高度以创建堆叠效果
plot(xi, f + i, 'LineWidth', 2);
hold on;
end

% 添加图例和坐标轴标签
legend('Group 1', 'Group 2', 'Group 3', 'Group 4', 'Group 5', 'Group 6');
xlabel('Value');
ylabel('Density');
title('Ridge Plot Example');

% 显示图形
hold off;
为了进一步美化图形,添加一些元素和调整一些参数来增强其视觉效果。
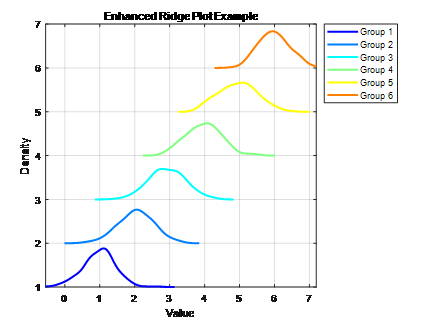
% 清空环境变量和窗口
clear; close all;

% 生成模拟数据
data = [];
groups = 6;
colors = jet(groups); % 使用彩虹色系
for i = 1:groups
data = [data; normrnd(i, 0.5, [200, 1])];
end

% 为每组数据创建一个标签
group = repelem(1:groups, 200)';

% 创建一个图形窗口
figure;

% 对每组数据进行绘制
for i = 1:groups
% 选择当前组的数据
subset = data(group == i);
% 计算核密度估计
[f, xi] = ksdensity(subset);
% 绘制密度曲线,并上移相应的高度以创建堆叠效果
plot(xi, f + i, 'LineWidth', 2, 'Color', colors(i, :));
hold on;
end

% 添加图例和坐标轴标签
legend('Group 1', 'Group 2', 'Group 3', 'Group 4', 'Group 5', 'Group 6', ...
'Location', 'northeastoutside');
xlabel('Value');
ylabel('Density');
title('Enhanced Ridge Plot Example');

% 设置坐标轴界限和网格
xlim([min(data), max(data)]);
ylim([1, groups + 1]);
grid on;

% 设置字体大小
set(gca, 'FontSize', 10);

% 显示图形
hold off;
下面两个是matalb美化后的版本
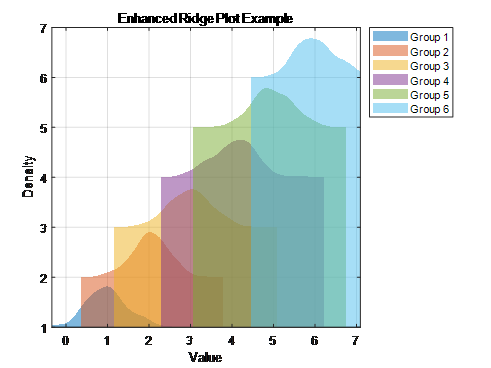
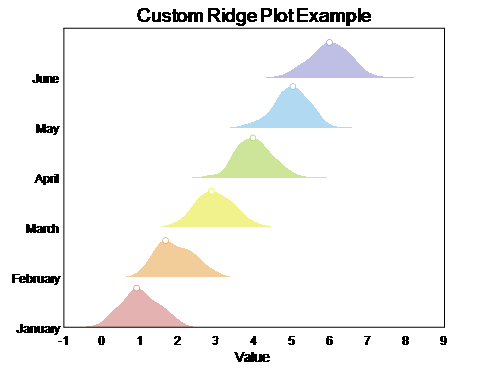
python
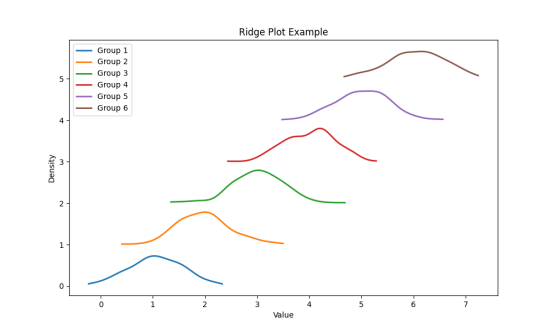
import numpy as np
import pandas as pd
import matplotlib.pyplot as plt
from scipy.stats import gaussian_kde

# 如果您想尝试使用默认样式,可以注释掉下面这行代码
# plt.style.use('seaborn')

# 生成模拟数据
groups = 6
data = pd.DataFrame({f'Group_{i}': np.random.normal(loc=i, scale=0.5, size=200) for i in range(1, groups + 1)})

# 转换为“长格式”
data_long = pd.melt(data, var_name='Group', value_name='Value')

# 初始化图形
fig, ax = plt.subplots(figsize=(10, 6))

# 对每组数据进行绘制
for i, group in enumerate(data.columns):
    # 选择当前组的数据
    subset = data[group]

    # 计算核密度估计
    density = gaussian_kde(subset)
    xs = np.linspace(subset.min(), subset.max(), 200)
    ys = density(xs)

    # 绘制密度曲线,并上移相应的高度以创建堆叠效果
    ax.plot(xs, ys + i, lw=2)

# 添加图例和坐标轴标签
ax.legend([f'Group {i + 1}' for i in range(groups)])
ax.set_xlabel('Value')
ax.set_ylabel('Density')
ax.set_title('Ridge Plot Example')

# 显示图形
plt.show()
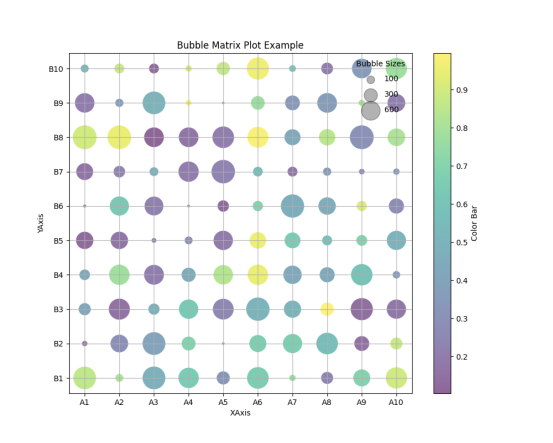
气泡矩阵图
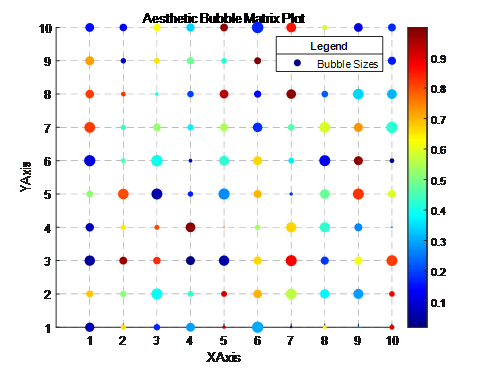
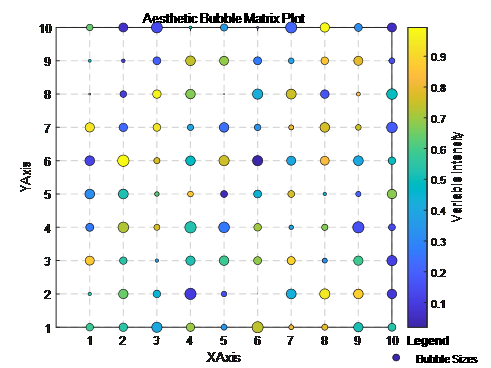
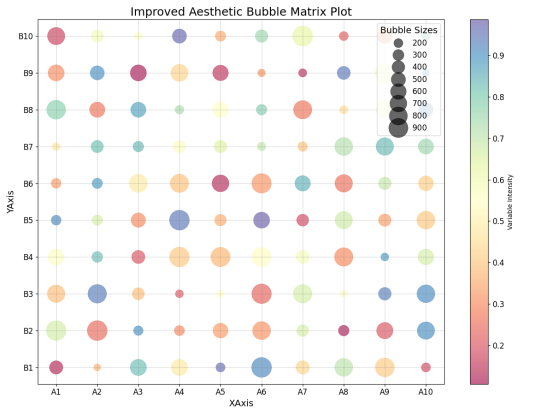
气泡矩阵图(Bubble Matrix Plot),通常用于显示三个变量之间的关系。这种图表类型将数据点表示为气泡的形式,其中气泡的大小通常表示第三个数值变量的大小。图表的X轴和Y轴代表两个分类或定量变量。颜色可能代表另一个分类变量或是另一个连续变量的梯度,这里颜色的深浅对应于颜色条(Color Bar)上的值。
实现
matlab
% MATLAB code to create an aesthetic bubble matrix plot

% Generate some example data
x_categories = 1:10;
y_categories = 1:10;
[X, Y] = meshgrid(x_categories, y_categories);
bubbleSizes = reshape(rand(size(X)), [], 1) * 100; % Random bubble sizes
colors = reshape(rand(size(X)), [], 1); % Random colors for the bubbles

% Create the figure
figure;

% Create the bubble plot using scatter
scatter(X(:), Y(:), bubbleSizes, colors, 'filled');

% Improve aesthetics
colormap('jet'); % Use the 'jet' colormap for color coding the bubbles
colorbar; % Show a color bar
title('Aesthetic Bubble Matrix Plot');
xlabel('XAxis');
ylabel('YAxis');

% Change the axis to show the category names
xticks(x_categories);
xticklabels(arrayfun(@num2str, x_categories, 'UniformOutput', false));
yticks(y_categories);
yticklabels(arrayfun(@num2str, y_categories, 'UniformOutput', false));

% Add a grid
grid on;
set(gca, 'GridLineStyle', '--', 'GridColor', [0.5, 0.5, 0.5], 'GridAlpha', 0.7); % Use a gray color for the grid

% There is no tight_layout in MATLAB, but you can manually adjust subplot margins or use 'axis tight'
% axis tight; % Uncomment this if you want to remove white space around the axes

% Add a legend for the bubble sizes
lgd = legend('Bubble Sizes');
title(lgd, 'Legend');
为了进一步美化,我们使用了更现代的parula颜色映射,并为每个气泡添加了黑色的边缘,以便更好地与背景区分。同时,我对颜色条标签和标题的字体大小进行了调整,并设置了图例的位置和样式,使其更加美观。
python
import matplotlib.pyplot as plt
import numpy as np

# Generate example data
x_categories = ['A1', 'A2', 'A3', 'A4', 'A5', 'A6', 'A7', 'A8', 'A9', 'A10']
y_categories = ['B1', 'B2', 'B3', 'B4', 'B5', 'B6', 'B7', 'B8', 'B9', 'B10']
x = np.repeat(range(len(x_categories)), len(y_categories))
y = np.tile(range(len(y_categories)), len(x_categories))
bubble_sizes = np.random.uniform(10, 1000, size=len(x)) # Bubble sizes
colors = np.random.uniform(0.1, 1, size=len(x)) # Color values

# Create the bubble matrix plot
plt.figure(figsize=(10, 8))
scatter = plt.scatter(x, y, s=bubble_sizes, c=colors, cmap='viridis', alpha=0.6, edgecolors="w", linewidth=0.5)

# Add titles and labels
plt.title('Bubble Matrix Plot Example')
plt.xlabel('XAxis')
plt.ylabel('YAxis')

# Change the axis to show the category names
plt.xticks(ticks=np.arange(len(x_categories)), labels=x_categories)
plt.yticks(ticks=np.arange(len(y_categories)), labels=y_categories)

# Add a color bar
plt.colorbar(scatter, label='Color Bar')

# Add a legend for sizes
for size in [100, 300, 600]:
    plt.scatter([], [], c='k', alpha=0.3, s=size, label=str(size))
plt.legend(scatterpoints=1, frameon=False, labelspacing=1, title='Bubble Sizes')

plt.grid(True)
plt.show()
为了进一步美化,我们使用了Spectral色彩映射来提供一个更丰富的颜色梯度。调整了标题和标签的字体大小,以提高可读性。修改了颜色条和图例,使其更具有信息性且易于阅读。添加了网格线,并调整了其样式以更加微妙且不干扰数据的展示。
后续
后续还会更新,百分比堆叠线条图、火山图、玫瑰图…有任何问题欢迎留言!需要完成的matlab和python代码看下面!
本文来自互联网用户投稿,该文观点仅代表作者本人,不代表本站立场。本站仅提供信息存储空间服务,不拥有所有权,不承担相关法律责任。 如若内容造成侵权/违法违规/事实不符,请联系我的编程经验分享网邮箱:chenni525@qq.com进行投诉反馈,一经查实,立即删除!
- Python教程
- 深入理解 MySQL 中的 HAVING 关键字和聚合函数
- Qt之QChar编码(1)
- MyBatis入门基础篇
- 用Python脚本实现FFmpeg批量转换
- vue的computed中的getter和setter
- 深入剖析pcap中的网络异常:TTL过期攻击、ARP中毒、TCP重传与重叠碎片等
- Kubernetes与Docker:容器编排的未来
- python/selenium/jenkins整合
- yolov5训练自己的数据集
- 用Python和Scrapy来构建强大的网络爬虫
- 《闪耀暖暖》大粉卷16万后跑路,女性向游戏饭圈化难阻挡
- vivo 海量微服务架构最新实践
- linux手动安装jdk压缩包并配置环境变量
- 上海交通大学生存手册