漏刻有时数据可视化Echarts组件开发(44)提示框组件与返回多边形
发布时间:2023年12月17日

CSS样式表
#lock_box {
            padding: 0;
            margin: 0;
            height: 100%;
            width: 100%;
        }

        .tipsBox {
            background: transparent url("images/tipsbg.png") top center no-repeat;
            width: 260px;
            height: 203px;
            box-shadow: none;
        }

        .tipsBox > p:first-child {
            padding-left: 35px;
            font-weight: bold;
            color: #0C0C0C;
            padding-top: 50px;
        }

        .tipsBox > p:nth-child(2) {
            display: inline-block;
            width: 200px;
            height: auto;
            margin: 0px 35px;
            white-space: normal
        }

        .tipsBox > p:nth-child(3) {
            padding-right: 40px;
            margin-top: -10px;
            text-align: right;
        }
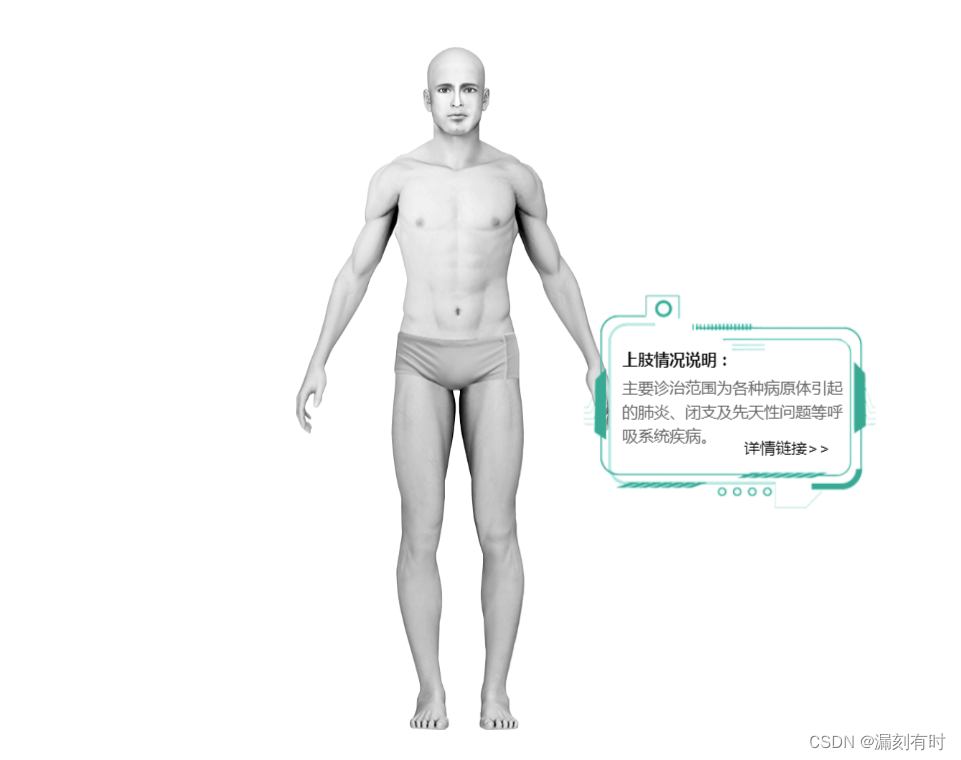
提示层HTML代码
       tooltip: {
                show: true,
                backgroundColor: 'transparent',
                borderWidth: 0,
                confine: true,
                enterable: true,
                shadowColor: 'transparent',
                formatter: function (d) {
                    //console.log(d.seriesName)
                    var tipsHtml = '<div class="tipsBox">' +
                        '    <p>' + d.seriesName + '情况说明:</p>' +
                        '    <p style="margin-top: -10px;">主要诊治范围为各种病原体引起的肺炎、闭支及先天性问题等呼吸系统疾病。</p>' +
                        '    <p><a href="#">详情链接>></a></p>' +
                        '</div>';
                    return tipsHtml;
                }
            },
返回多边形
{
                    name: '上肢',
                    type: 'custom',
                    coordinateSystem: 'geo',
                    renderItem: function renderItem(params, api) {
                        var coords = [
                            [134.12279151943466, 67.16607773851591],
                            [160.8842756183746, 130.65901060070672],
                            [166.13162544169614, 132.2332155477032],
                            [143.04328621908132, 63.49293286219082],
                        ];
                        var points = [];
                        for (var i = 0; i < coords.length; i++) {
                            points.push(api.coord(coords[i]));
                        }
                        //console.log(points);
                        return {
                            type: 'polygon',
                            style: {
                                opacity: 0
                            },
                            shape: {
                                points: points
                            }
                        };
                    }
renderItem函数
renderItem 是 ECharts 中的一个函数,它主要用于自定义渲染每个数据项。这个函数会在每个数据项绘制前被调用,传入参数为 {number} seriesIndex, {number} dataIndex,返回值为渲染的 DOM 节点。
在 ECharts 中,我们可以通过 renderItem 函数来自定义每个数据项的渲染方式,例如可以修改数据项的颜色、形状、大小等。
以下是一个使用 renderItem 函数的简单示例:
option = {
    xAxis: {
        type: 'category',
        data: ['Mon', 'Tue', 'Wed', 'Thu', 'Fri', 'Sat', 'Sun']
    },
    yAxis: {
        type: 'value'
    },
    series: [{
        data: [120, 200, 150, 80, 70, 110, 130],
        type: 'bar',
        renderItem: function (params, api) {
            var categoryIndex = api.value(0);
            var start = api.coord([api.value(1), categoryIndex]);
            var end = api.coord([api.value(2), categoryIndex]);
            var width = api.size([0, 1])[0];
            var itemStyle = {
                color: api.style('color')
            };
            var node = api.wrap.rect(start, end, width, 10, itemStyle);
            if (params.emphasis) {
                node.style({
                    opacity: 0.7
                });
            }
            return node;
        },
        symbol: 'emptyCircle'
    }]
};
在这个例子中,我们自定义了柱状图的渲染方式。renderItem 函数接收两个参数:params 和 api。params 对象包含了当前数据项的所有信息,如 seriesIndex, dataIndex 等。而 api 对象则是一组 API 方法,如 api.coord, api.size, api.style 等,用于计算坐标、获取尺寸和样式等。通过这些 API 方法,我们可以计算出每个数据项的位置和样式,并返回一个渲染的 DOM 节点。
@漏刻有时
文章来源:https://blog.csdn.net/weixin_41290949/article/details/135032425
本文来自互联网用户投稿,该文观点仅代表作者本人,不代表本站立场。本站仅提供信息存储空间服务,不拥有所有权,不承担相关法律责任。 如若内容造成侵权/违法违规/事实不符,请联系我的编程经验分享网邮箱:chenni525@qq.com进行投诉反馈,一经查实,立即删除!
本文来自互联网用户投稿,该文观点仅代表作者本人,不代表本站立场。本站仅提供信息存储空间服务,不拥有所有权,不承担相关法律责任。 如若内容造成侵权/违法违规/事实不符,请联系我的编程经验分享网邮箱:chenni525@qq.com进行投诉反馈,一经查实,立即删除!
最新文章
- Python教程
- 深入理解 MySQL 中的 HAVING 关键字和聚合函数
- Qt之QChar编码(1)
- MyBatis入门基础篇
- 用Python脚本实现FFmpeg批量转换
- 数据库系统原理总结之——数据库安全与保护
- 大模型基础架构的变革:剖析Transformer的挑战者(上)
- 【NR技术】 EN-DC移动性流程
- LeetCode //C - 1431. Kids With the Greatest Number of Candies
- Adobe Premier及PrElements各版本安装指南
- windows应急响应基础(基础和常用命令)
- 备战2个月,面试被问麻了....
- Doris初识(01)
- Milvus向量数据库基础用法及注意细节
- 网络通信(5)-交换机介绍