2024 解决matplotlib中文字体问题
发布时间:2024年01月15日
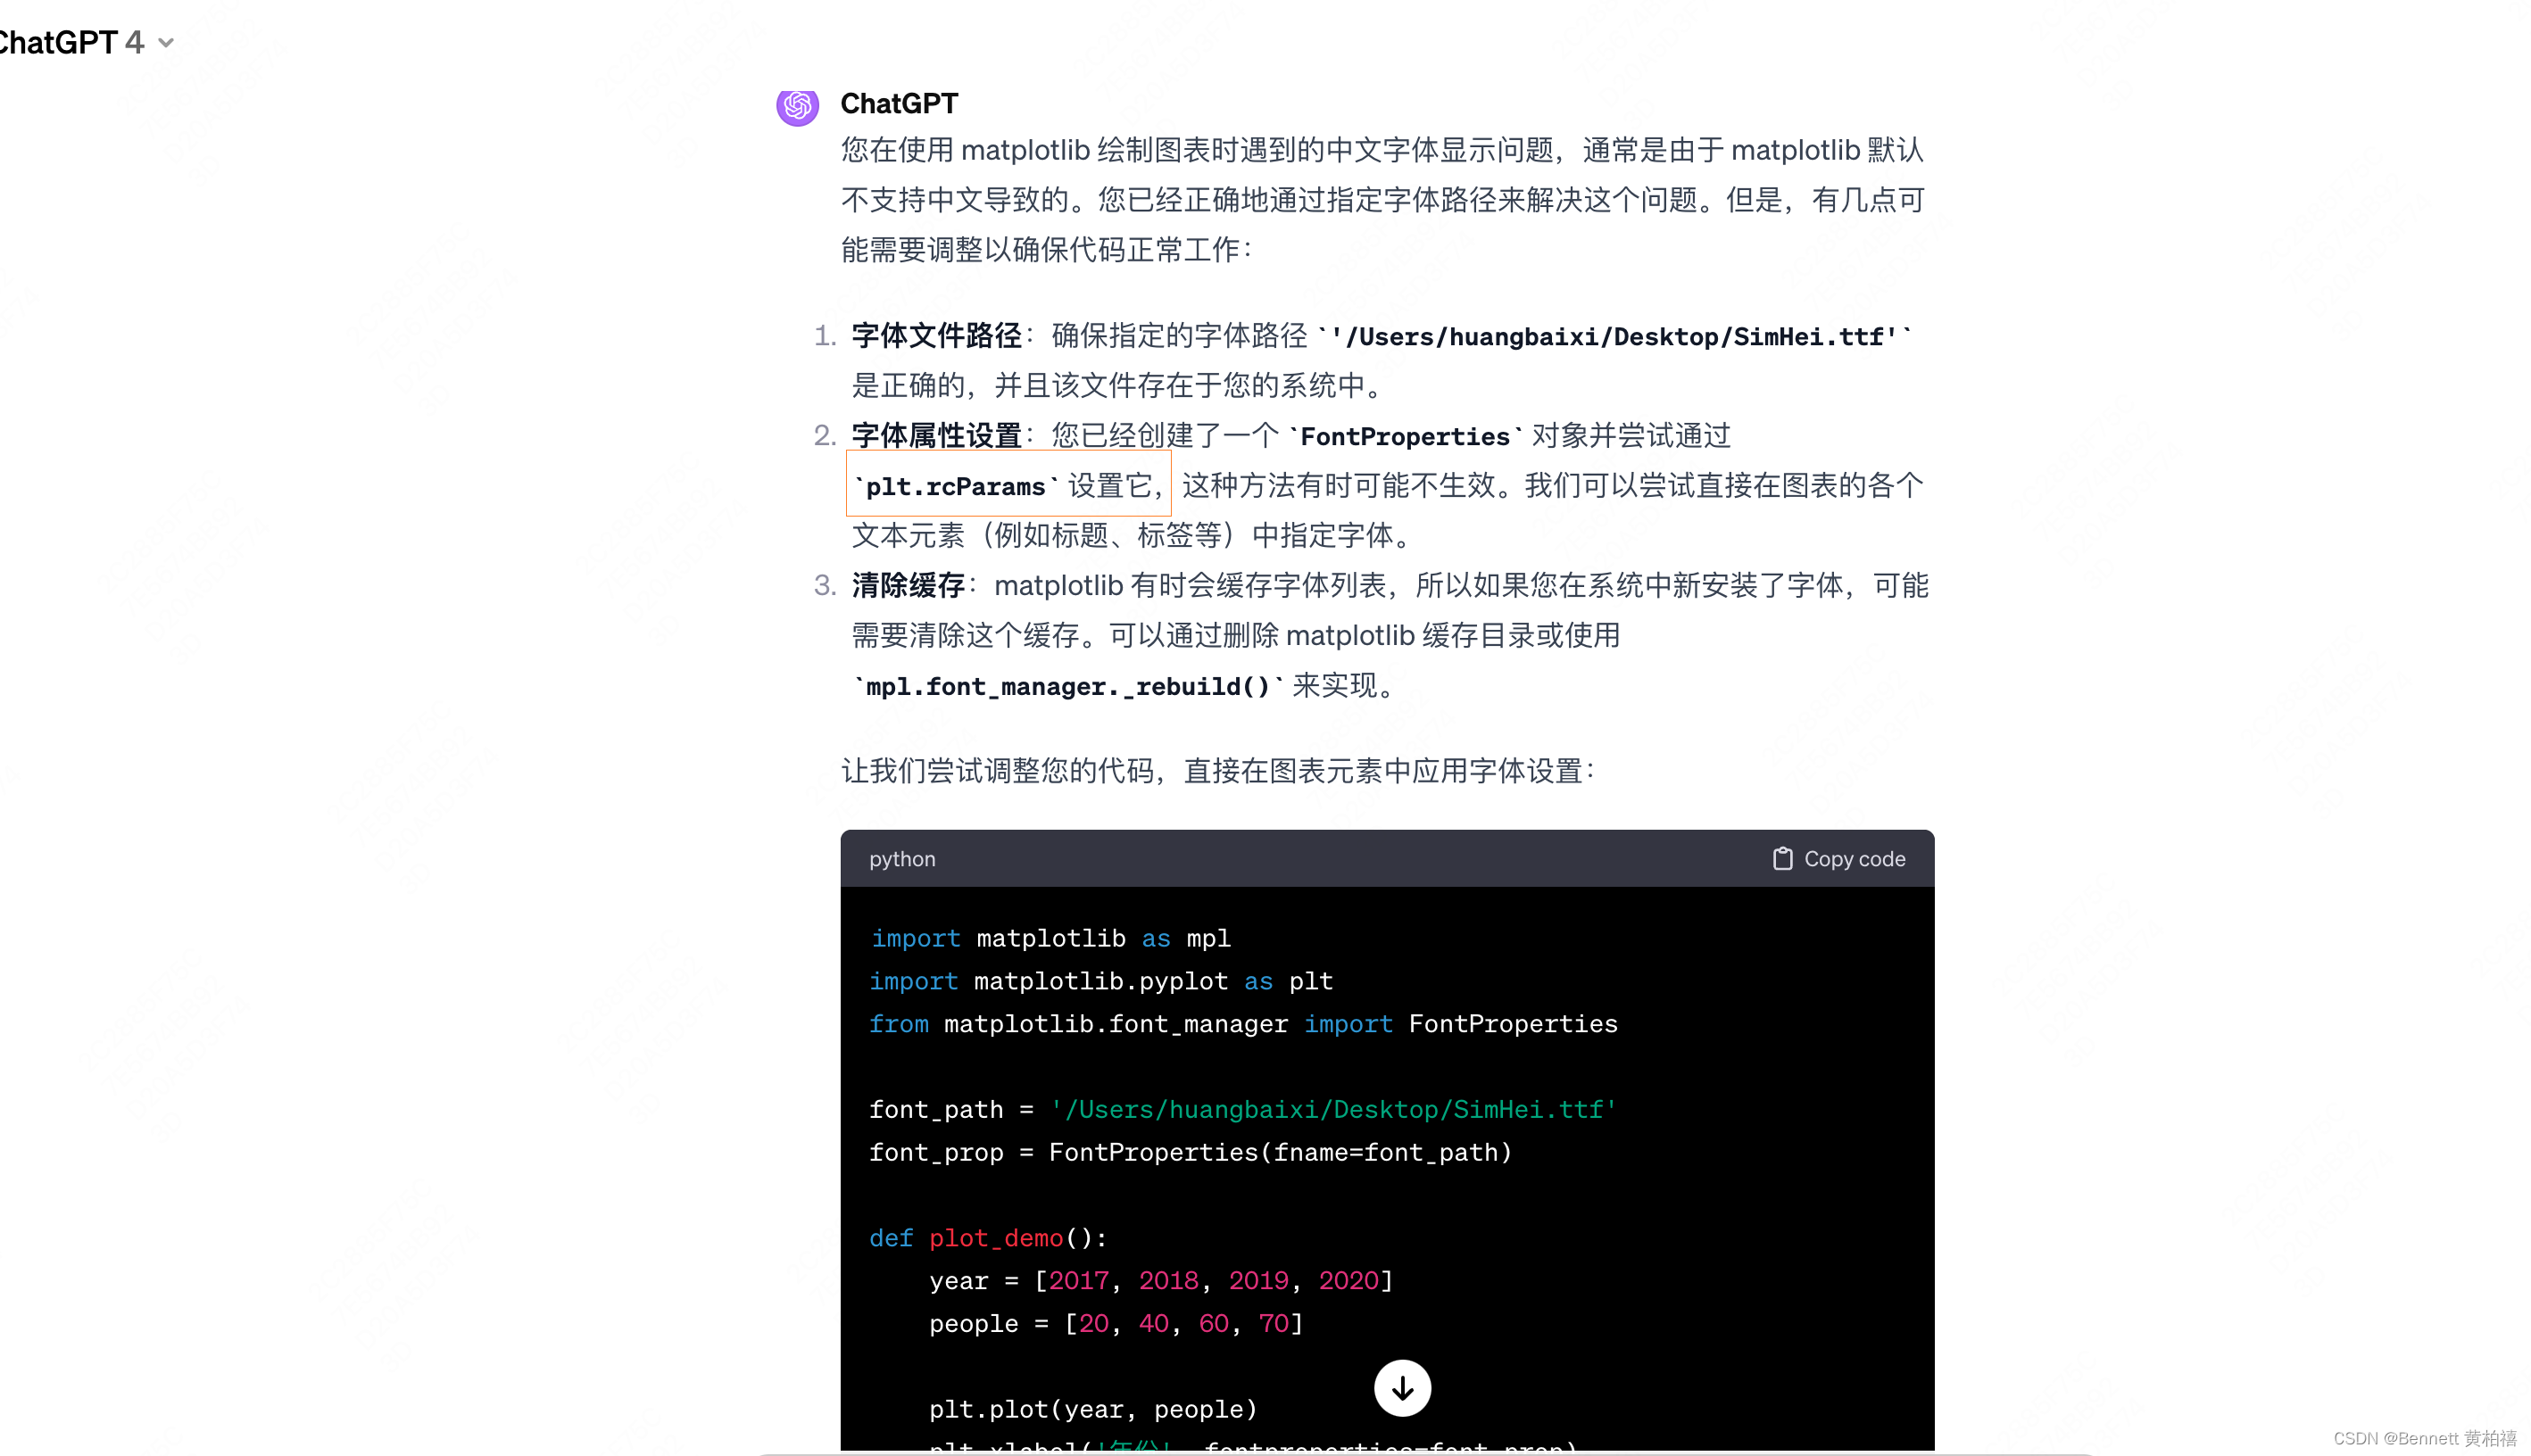
第一种代码(失败代码)
import matplotlib as mpl
import matplotlib.pyplot as plt
from matplotlib.font_manager import FontProperties

font_path = '/Users/huangbaixi/Desktop/SimHei.ttf'

def plot_demo():
    #print(mpl.get_cachedir())
    # 绘制折线图
    font_prop = FontProperties(fname=font_path)
    plt.rcParams['font.sans-serif'] = [font_prop.get_name()]
    plt.rcParams['axes.unicode_minus'] = False
    year = [2017, 2018, 2019, 2020]
    people = [20, 40, 60, 70]
    # 生成图表
    plt.plot(year, people)
    plt.xlabel('年份')
    plt.ylabel('人口')
    plt.title('人口增长')
    # 设置纵坐标刻度
    plt.yticks([0, 20, 40, 60, 80])
    # 设置填充选项:参数分别对应横坐标,纵坐标,纵坐标填充起始值,填充颜色
    plt.fill_between(year, people, 20, color='green')
    # 显示图表
    # plt.savefig("./plt.png")
    plt.show()
这一版代码会出现
findfont: Generic family ‘sans-serif’ not found because none of the following families were found: SimHei
查询发现:
rcParams 有概率失败
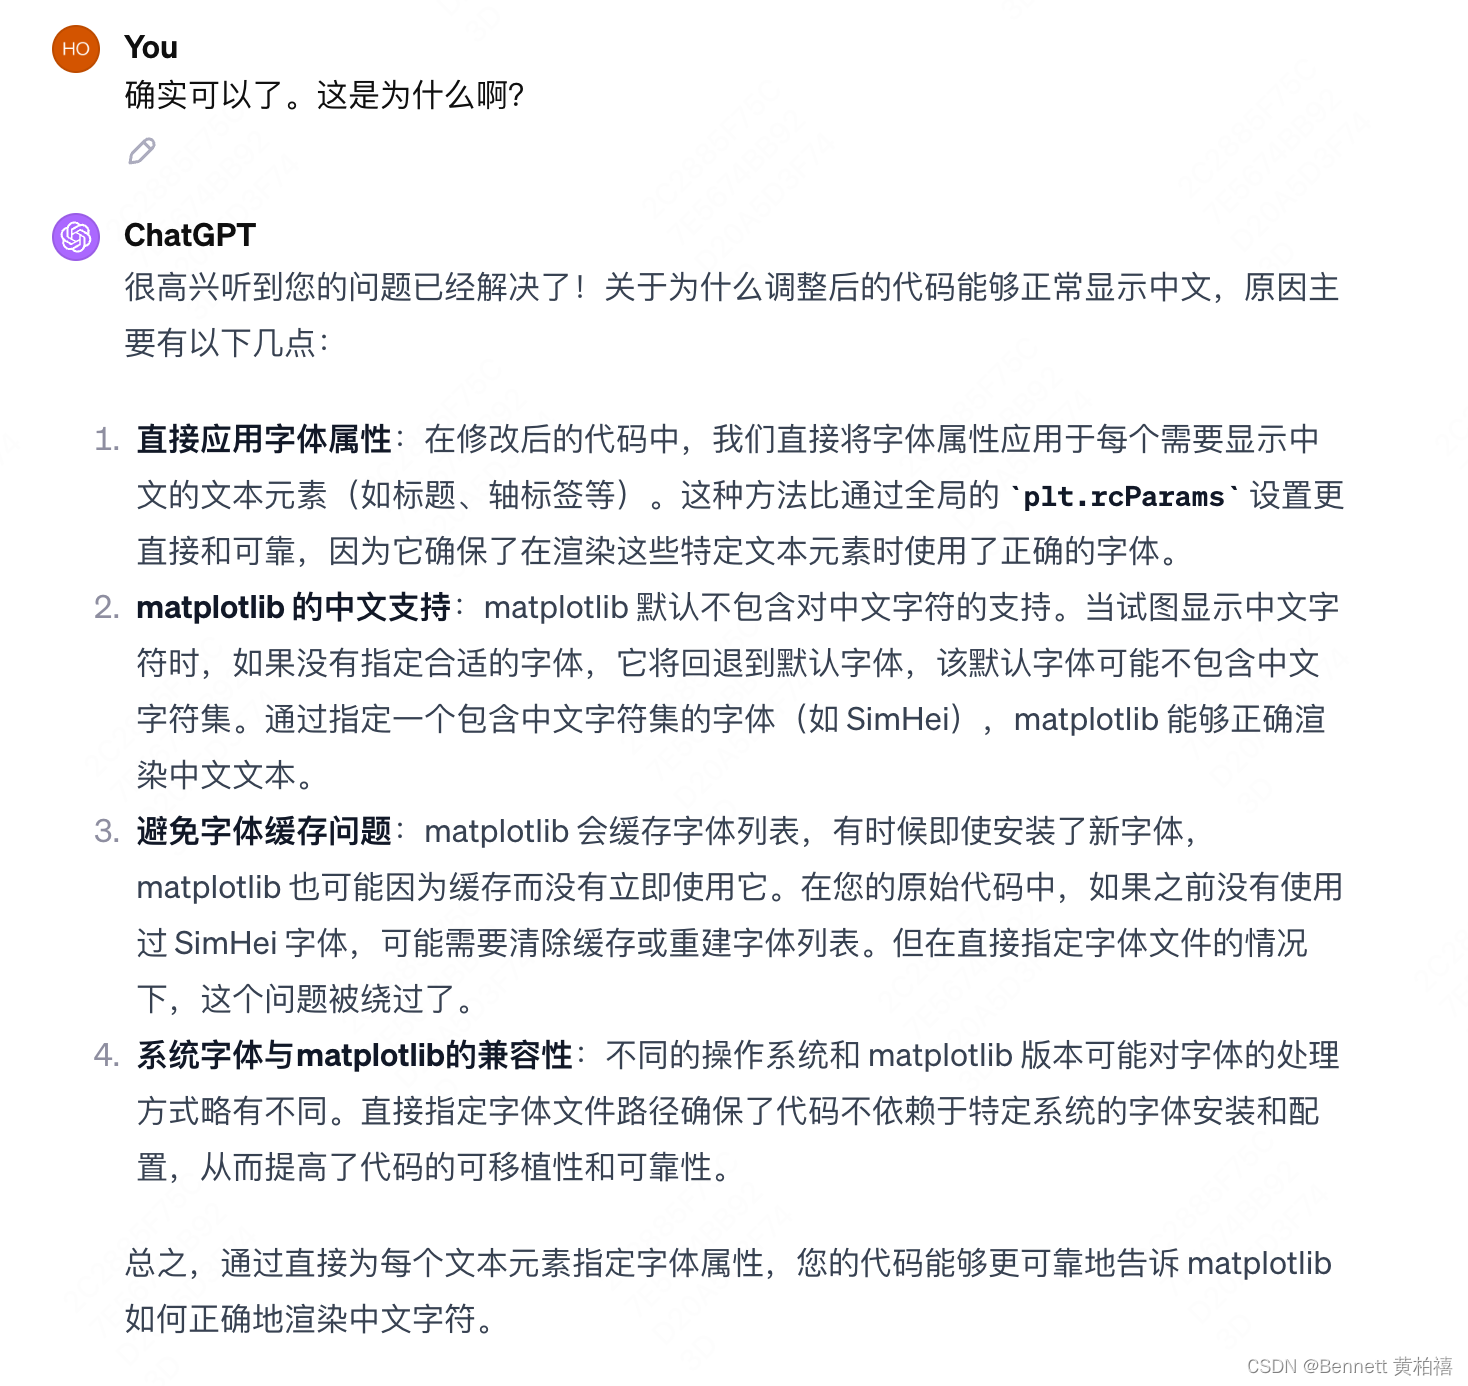
第二种方法(指定应用)
import matplotlib as mpl
import matplotlib.pyplot as plt
from matplotlib.font_manager import FontProperties

font_path = '/Users/huangbaixi/Desktop/SimHei.ttf'
font_prop = FontProperties(fname=font_path)

def plot_demo():
    year = [2017, 2018, 2019, 2020]
    people = [20, 40, 60, 70]

    plt.plot(year, people)
    plt.xlabel('年份', fontproperties=font_prop)
    plt.ylabel('人口', fontproperties=font_prop)
    plt.title('人口增长', fontproperties=font_prop)
    plt.yticks([0, 20, 40, 60, 80])
    plt.fill_between(year, people, 20, color='green')
    plt.show()

plot_demo()
这是成功的。
第三种方法(全局应用)
import matplotlib
# font_path = '/usr/share/fonts/SimHei.ttf'
font_path = '/Users/huangbaixi/Desktop/SimHei.ttf'
# 添加字体路径
matplotlib.font_manager.fontManager.addfont(font_path)

# 设置 matplotlib 的全局参数
matplotlib.rcParams['font.family'] = 'sans-serif'
matplotlib.rcParams['font.sans-serif'] = ['SimHei']  # 使用 SimHei 字体
matplotlib.rcParams['axes.unicode_minus'] = False  # 正常显示负号

# 定义绘图函数
def plot_demo():
    year = [2017, 2018, 2019, 2020]
    people = [20, 40, 60, 70]

    plt.plot(year, people)
    plt.xlabel('年份')
    plt.ylabel('人口')
    plt.title('人口增长')
    plt.yticks([0, 20, 40, 60, 80])
    plt.fill_between(year, people, 20, color='green')
    plt.show()
这也是可以的。
文章来源:https://blog.csdn.net/huangbx_tx/article/details/135605867
本文来自互联网用户投稿,该文观点仅代表作者本人,不代表本站立场。本站仅提供信息存储空间服务,不拥有所有权,不承担相关法律责任。 如若内容造成侵权/违法违规/事实不符,请联系我的编程经验分享网邮箱:chenni525@qq.com进行投诉反馈,一经查实,立即删除!
本文来自互联网用户投稿,该文观点仅代表作者本人,不代表本站立场。本站仅提供信息存储空间服务,不拥有所有权,不承担相关法律责任。 如若内容造成侵权/违法违规/事实不符,请联系我的编程经验分享网邮箱:chenni525@qq.com进行投诉反馈,一经查实,立即删除!
最新文章
- Python教程
- 深入理解 MySQL 中的 HAVING 关键字和聚合函数
- Qt之QChar编码(1)
- MyBatis入门基础篇
- 用Python脚本实现FFmpeg批量转换
- 【AI】计算机视觉VIT文章(Transformer)源码解析
- Vue 中使用 ECharts
- 基于Kettle开发的web版数据集成开源工具(data-integration)-介绍篇
- Stable Diffusion超详细教程!从0-1入门到进阶
- 【LeetCode刷题笔记】贪心
- YOLOv8-Seg改进:Backbone改进 | 支持restnet50和restnet101
- Mybatis中的${}和#{}区别
- Java版商城:Spring Cloud+SpringBoot b2b2c实现多商家入驻、直播带货及免 费小程序商城搭建
- 二、数据类型(1)
- Java Web Day03_CSS样式