结合Tensuns管理prometheus的blackbox与告警设置
场景说明:
因为业务服务器已经完成了三级等保,禁止在业务服务器上部署任何应用,遂选择一台新的服务器部署prometheus,采用blackbox_exporter监控业务服务器的端口与域名状态。?
Tensuns项目介绍
https://github.com/starsliao/TenSunS
?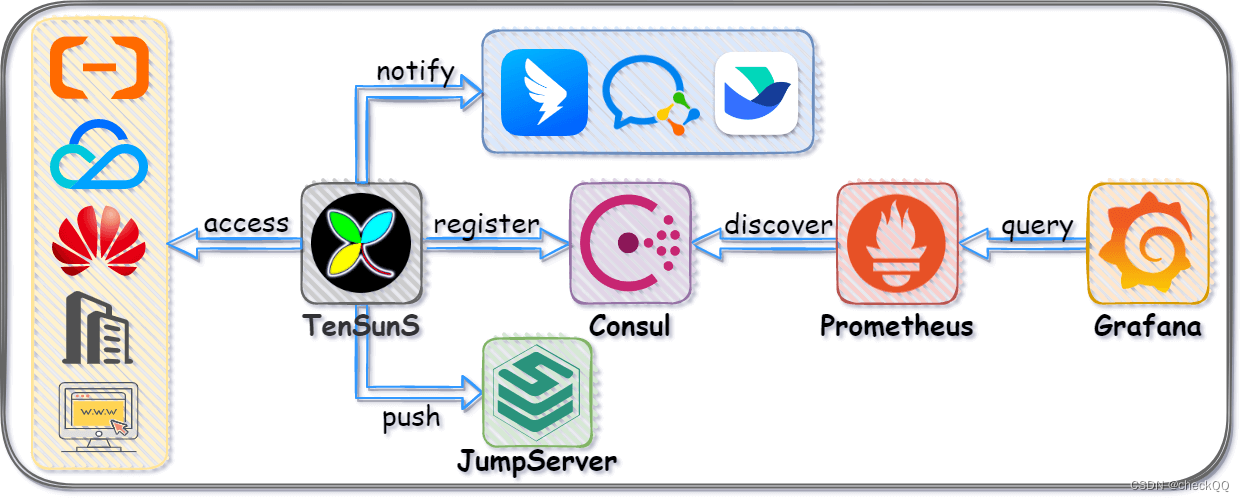
后羿 - TenSunS(原ConsulManager)是一个使用Flask+Vue开发,基于Consul的WEB运维平台,弥补了Consul官方UI对Services管理的不足;并且基于Consul的服务发现与键值存储:实现了Prometheus自动发现多云厂商各资源信息;基于Blackbox对站点监控的可视化维护;以及对自建与云上资源的优雅管理与展示。?
安装Tensuns
选择使用docker-compose安装
vim install_Tensuns.sh
#!/bin/bash
export PATH=$PATH:/sbin:/bin:/usr/sbin:/usr/bin:/usr/local/sbin:/usr/local/bin
tsspath="/opt/tensuns"
uuid=`uuidgen`
adminpwd=`uuidgen|awk -F- '{print $1}'`
mkdir -p $tsspath/consul/config
cat <<EOF > $tsspath/consul/config/consul.hcl
log_level = "error"
data_dir = "/consul/data"
client_addr = "0.0.0.0"
ui_config{
  enabled = true
}
ports = {
  grpc = -1
  https = -1
  dns = -1
  grpc_tls = -1
  serf_wan = -1
}
peering {
  enabled = false
}
connect {
  enabled = false
}
server = true
bootstrap_expect=1
acl = {
  enabled = true
  default_policy = "deny"
  enable_token_persistence = true
  tokens {
    initial_management = "$uuid"
    agent = "$uuid"
  }
}
EOF
chmod 777 -R $tsspath/consul/config
cat <<EOF > $tsspath/docker-compose.yaml
version: '3.6'
services:
  consul:
    image: swr.cn-south-1.myhuaweicloud.com/starsl.cn/consul:latest
    container_name: consul
    hostname: consul
    restart: always
    ports:
      - "8500:8500"
    volumes:
     - $tsspath/consul/data:/consul/data
     - $tsspath/consul/config:/consul/config
     - /usr/share/zoneinfo/PRC:/etc/localtime
    command: "agent"
    networks:
      - TenSunS

  flask-consul:
    image: swr.cn-south-1.myhuaweicloud.com/starsl.cn/flask-consul:latest
    container_name: flask-consul
    hostname: flask-consul
    restart: always
    volumes:
      - /usr/share/zoneinfo/PRC:/etc/localtime
    environment:
      consul_token: $uuid
      consul_url: http://consul:8500/v1
      admin_passwd: $adminpwd
      log_level: INFO
    depends_on:
      - consul
    networks:
      - TenSunS

  nginx-consul:
    image: swr.cn-south-1.myhuaweicloud.com/starsl.cn/nginx-consul:latest
    container_name: nginx-consul
    hostname: nginx-consul
    restart: always
    ports:
      - "1026:1026"
    volumes:
      - /usr/share/zoneinfo/PRC:/etc/localtime
    depends_on:
      - flask-consul
    networks:
      - TenSunS

networks:
  TenSunS:
    name: TenSunS
    driver: bridge
    ipam:
      driver: default
EOF

echo -e "\n\033[31;1m正在启动后羿运维平台...\033[0m"
cd $tsspath && docker-compose up -d
echo -e "\n后羿运维平台默认的admin密码是:\033[31;1m$adminpwd\033[0m\n修改密码请编辑 $tsspath/docker-compose.yaml 查找并修改变量 admin_passwd 的值\n"
echo -e "请使用浏览器访问 http://{你的IP}:1026 并登录使用\n"
echo -e "\033[31;1mhttp://`ip route get 1.2.3.4 | awk '{print $NF}'|head -1`:1026\033[0m\n"
bash?install_Tensuns.sh
#执行脚本前,先安装docker与docker-compose,安装后使用IP:1026登录


安装Alertmanager
安装包下载:Download | Prometheus
alertmanager-0.26.0.linux-amd64
设置启动脚本vim /etc/systemd/system/alertmanager.service
[Unit]
Description=Alertmanager
Wants=network-online.target
After=network-online.target

[Service]
Type=simple
ExecStart=/opt/alertmanager-0.26.0.linux-amd64/alertmanager \
  --config.file=/opt/alertmanager-0.26.0.linux-amd64/alertmanager.yml \
  --storage.path=/opt/alertmanager-0.26.0.linux-amd64/data
#  --web.listen-address=:9081
#修改启动端口为9081
ExecReload=/bin/kill -HUP $MAINPID
Restart=always

[Install]
WantedBy=multi-user.target
systemctl daemon-reload ? ? ?
systemctl start alertmanager?
systemctl enable alertmanager
systemctl status alertmanager?
Alertmanager配置文件修改
vim alertmanager.yml
global:
  resolve_timeout: 5m
  smtp_smarthost: 'smtp.qq.com:465'
  smtp_from: '******@qq.com'
  smtp_auth_username: '******@qq.com'
#SMTP授权码
  smtp_auth_password: 'kxtokczppbtabfbi'
  smtp_require_tls: false

#邮件模板
templates:
  - '/opt/alertmanager-0.26.0.linux-amd64/alertsend.tmpl'
route:
  group_by: ['alertname']
  group_wait: 30s
  group_interval: 2m
  repeat_interval: 10m
  receiver: 'email'

receivers:
- name: 'email'
  email_configs:
  - to: '*****@qq.com'
    html: '{{ template "email.to.html" . }}'
    send_resolved: true

inhibit_rules:
  - source_match:
      severity: 'critical'
    target_match:
      severity: 'warning'
#触发severity为critical的告警时,抑制[ 'name', 'env','project'],都相等的warning告警
    equal: [ 'name', 'env','project']
配置邮件模板:
vim?/opt/alertmanager-0.26.0.linux-amd64/alertsend.tmpl
{{ define "email.to.html" }}
{{ range .Alerts }}
告警程序: 域名IP端口检查告警 <br>
告警级别: {{ .Labels.severity }} 级 <br>
告警类型: {{ .Labels.alertname }} <br>
故障主机: {{ .Labels.instance }} <br>
故障项目: {{ .Labels.project }} <br>
故障环境: {{ .Labels.env }} <br>
告警详情: {{ .Annotations.description }} <br>
{{ end }}
Prometheus配置修改
vim?/opt/prometheus-2.46.0.linux-amd64/prometheus.yml?
注意:token: '0eed6b85-6c5a-40a9-b02d-4de1eeea8319'的值与Tensuns上的一致。# my global config global: scrape_interval: 15s # Set the scrape interval to every 15 seconds. Default is every 1 minute. evaluation_interval: 15s # Evaluate rules every 15 seconds. The default is every 1 minute. # scrape_timeout is set to the global default (10s). # Alertmanager configuration alerting: alertmanagers: - static_configs: - targets: - 127.0.0.1:9093 # Load rules once and periodically evaluate them according to the global 'evaluation_interval'. rule_files: - "rules.yml" # - "second_rules.yml" # A scrape configuration containing exactly one endpoint to scrape: # Here it's Prometheus itself. scrape_configs: # The job name is added as a label `job=<job_name>` to any timeseries scraped from this config. - job_name: "prometheus" # metrics_path defaults to '/metrics' # scheme defaults to 'http'. static_configs: - targets: ["localhost:9090"] - job_name: 'blackbox_exporter' scrape_interval: 15s scrape_timeout: 5s metrics_path: /probe consul_sd_configs: # - server: 'consul:8500' - server: '127.0.0.1:8500' token: '0eed6b85-6c5a-40a9-b02d-4de1eeea8319' services: ['blackbox_exporter'] relabel_configs: - source_labels: ["__meta_consul_service_metadata_instance"] target_label: __param_target - source_labels: [__meta_consul_service_metadata_module] target_label: __param_module - source_labels: [__meta_consul_service_metadata_module] target_label: module - source_labels: ["__meta_consul_service_metadata_company"] target_label: company - source_labels: ["__meta_consul_service_metadata_env"] target_label: env - source_labels: ["__meta_consul_service_metadata_name"] target_label: name - source_labels: ["__meta_consul_service_metadata_project"] target_label: project - source_labels: [__param_target] target_label: instance - target_label: __address__ replacement: 127.0.0.1:9115

添加告警规则rules.yml
vim /opt/prometheus-2.46.0.linux-amd64/rules.yml
groups:
  - name: Domain
    rules:
    - alert: 站点可用性
      expr: probe_success{job="blackbox_exporter"} == 0
      for: 1m
      labels:
        alertype: domain
        severity: critical
      annotations:
        description: "{{ $labels.env }}_{{ $labels.name }}({{ $labels.project }}):站点无法访问\n> {{ $labels.instance }}"

    - alert: 站点1h可用性低于80%
      expr: sum_over_time(probe_success{job="blackbox_exporter"}[1h])/count_over_time(probe_success{job="blackbox_exporter"}[1h]) * 100 < 80
      for: 3m
      labels:
        alertype: domain
        severity: warning
      annotations:
        description: "{{ $labels.env }}_{{ $labels.name }}({{ $labels.project }}):站点1h可用性:{{ $value | humanize }}%\n> {{ $labels.instance }}"

    - alert: 站点状态异常
      expr: (probe_success{job="blackbox_exporter"} == 0 and probe_http_status_code > 499) or probe_http_status_code == 0
      for: 1m
      labels:
        alertype: domain
        severity: warning
      annotations:
        description: "{{ $labels.env }}_{{ $labels.name }}({{ $labels.project }}):站点状态异常:{{ $value }}\n> {{ $labels.instance }}"

    - alert: 站点耗时过高
      expr: probe_duration_seconds > 0.5
      for: 2m
      labels:
        alertype: domain
        severity: warning
      annotations:
        description: "{{ $labels.env }}_{{ $labels.name }}({{ $labels.project }}):当前站点耗时:{{ $value | humanize }}s\n> {{ $labels.instance }}"

    - alert: SSL证书有效期
      expr: (probe_ssl_earliest_cert_expiry-time()) / 3600 / 24 < 15
      for: 2m
      labels:
        alertype: domain
        severity: warning
      annotations:
        description: "{{ $labels.env }}_{{ $labels.name }}({{ $labels.project }}):证书有效期剩余{{ $value | humanize }}天\n> {{ $labels.instance }}"
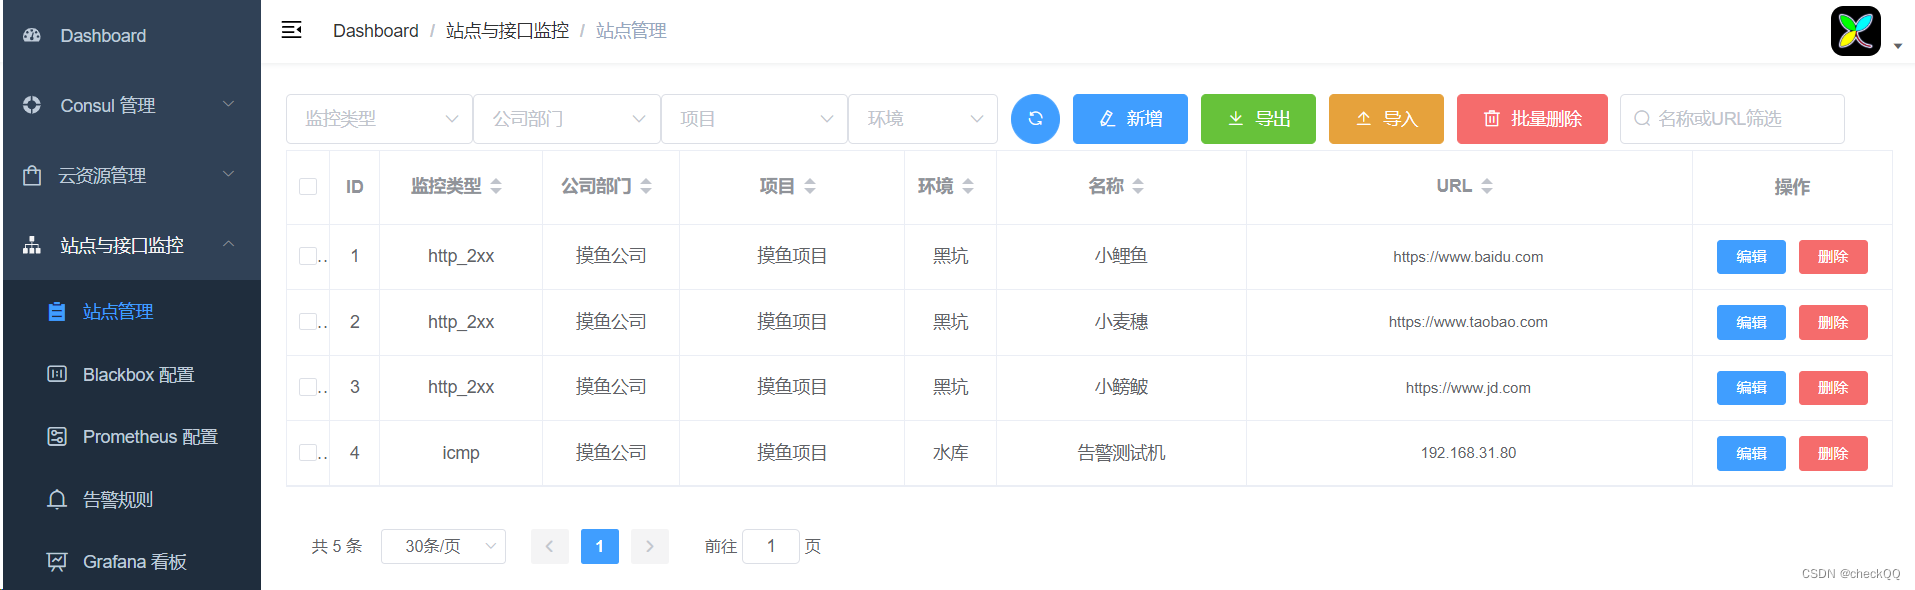
Tensuns结果验证:
登录Tensun添加需要被监控资源列表
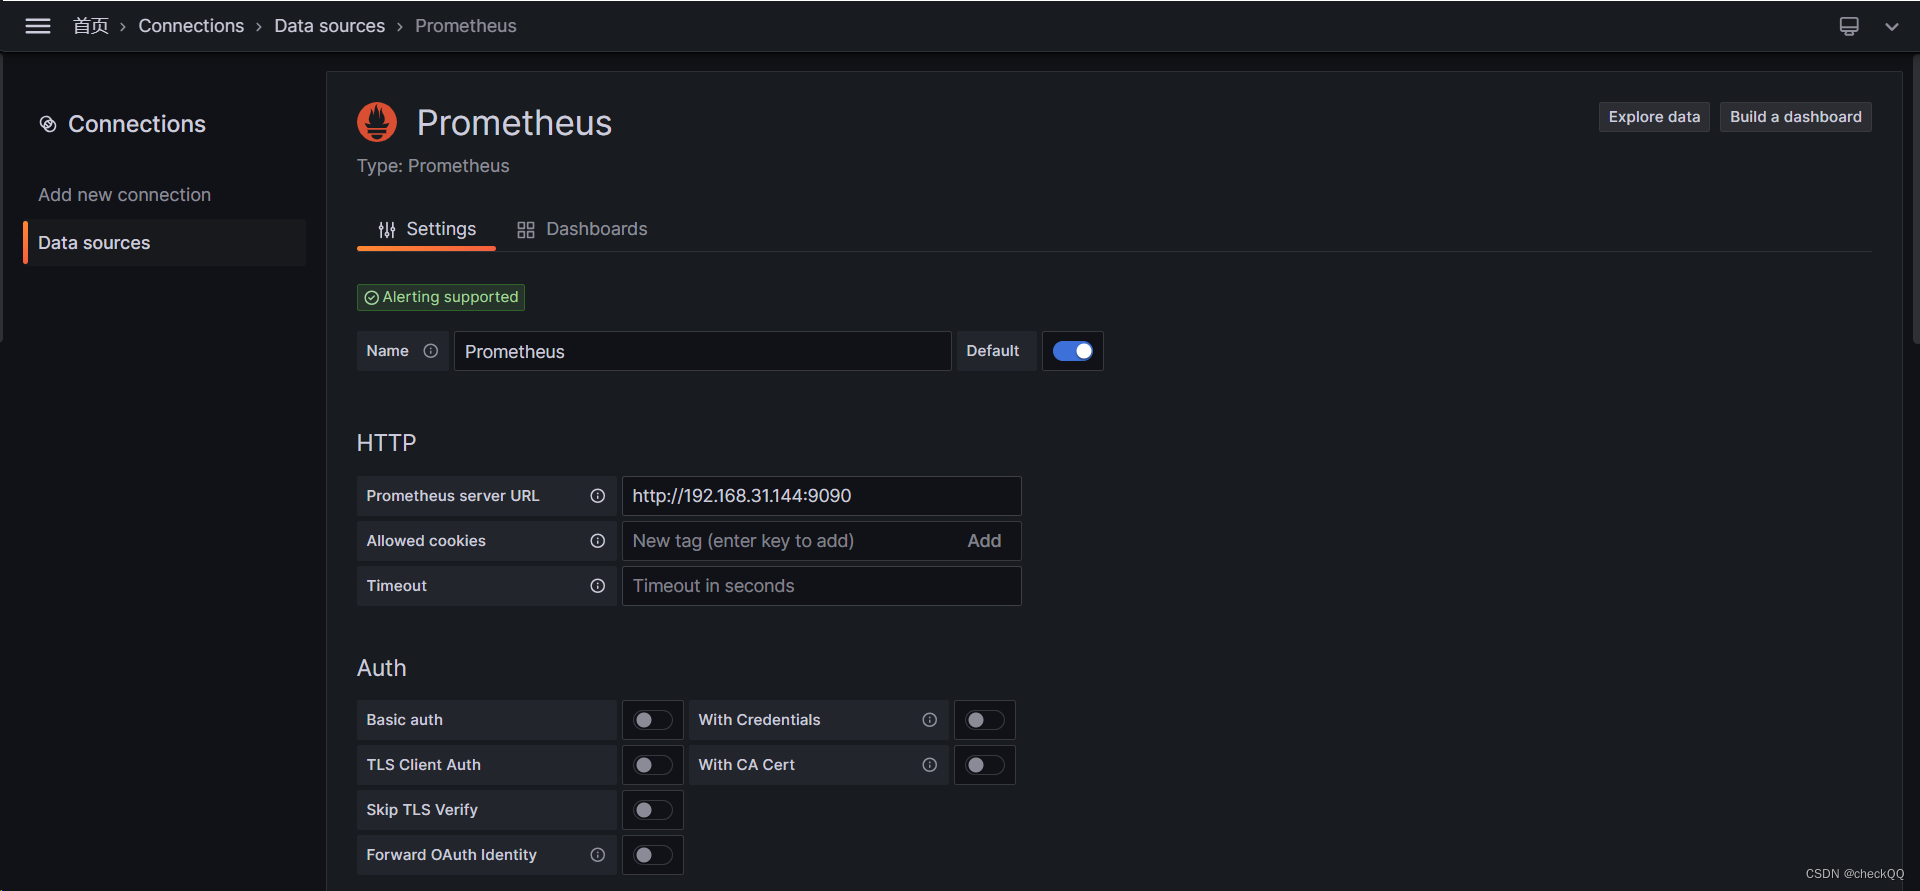
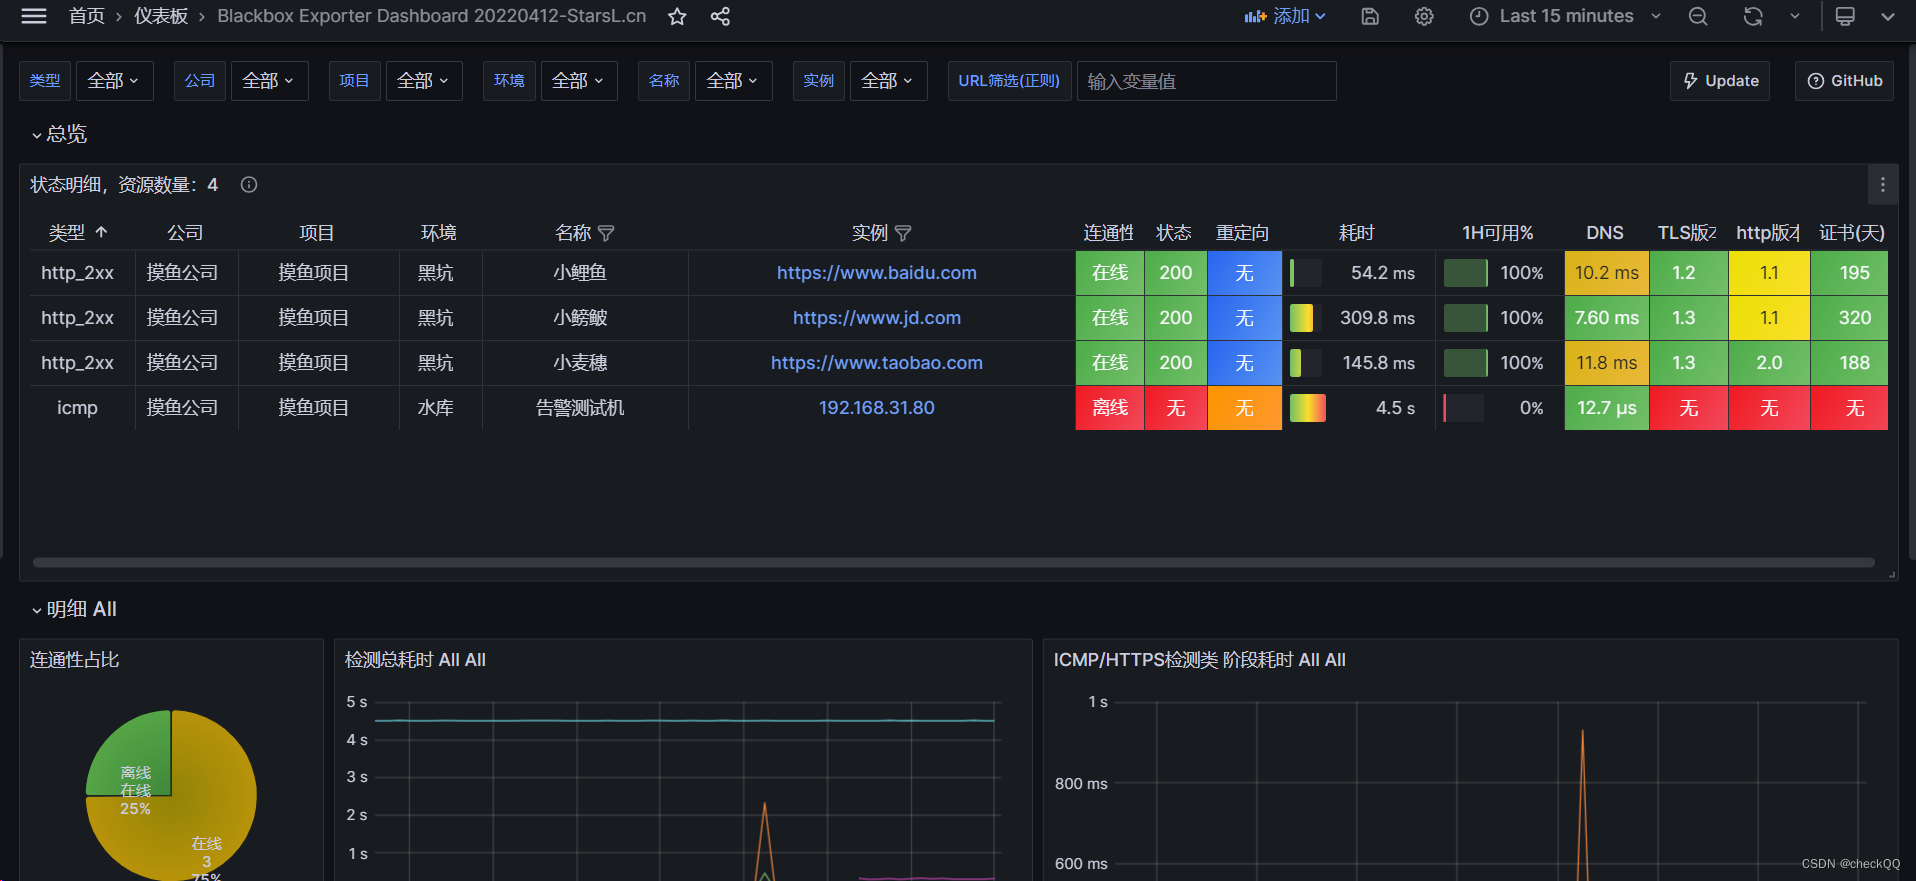
登录Grafana配置数据源与dashboard
dashboard选择ID:9965
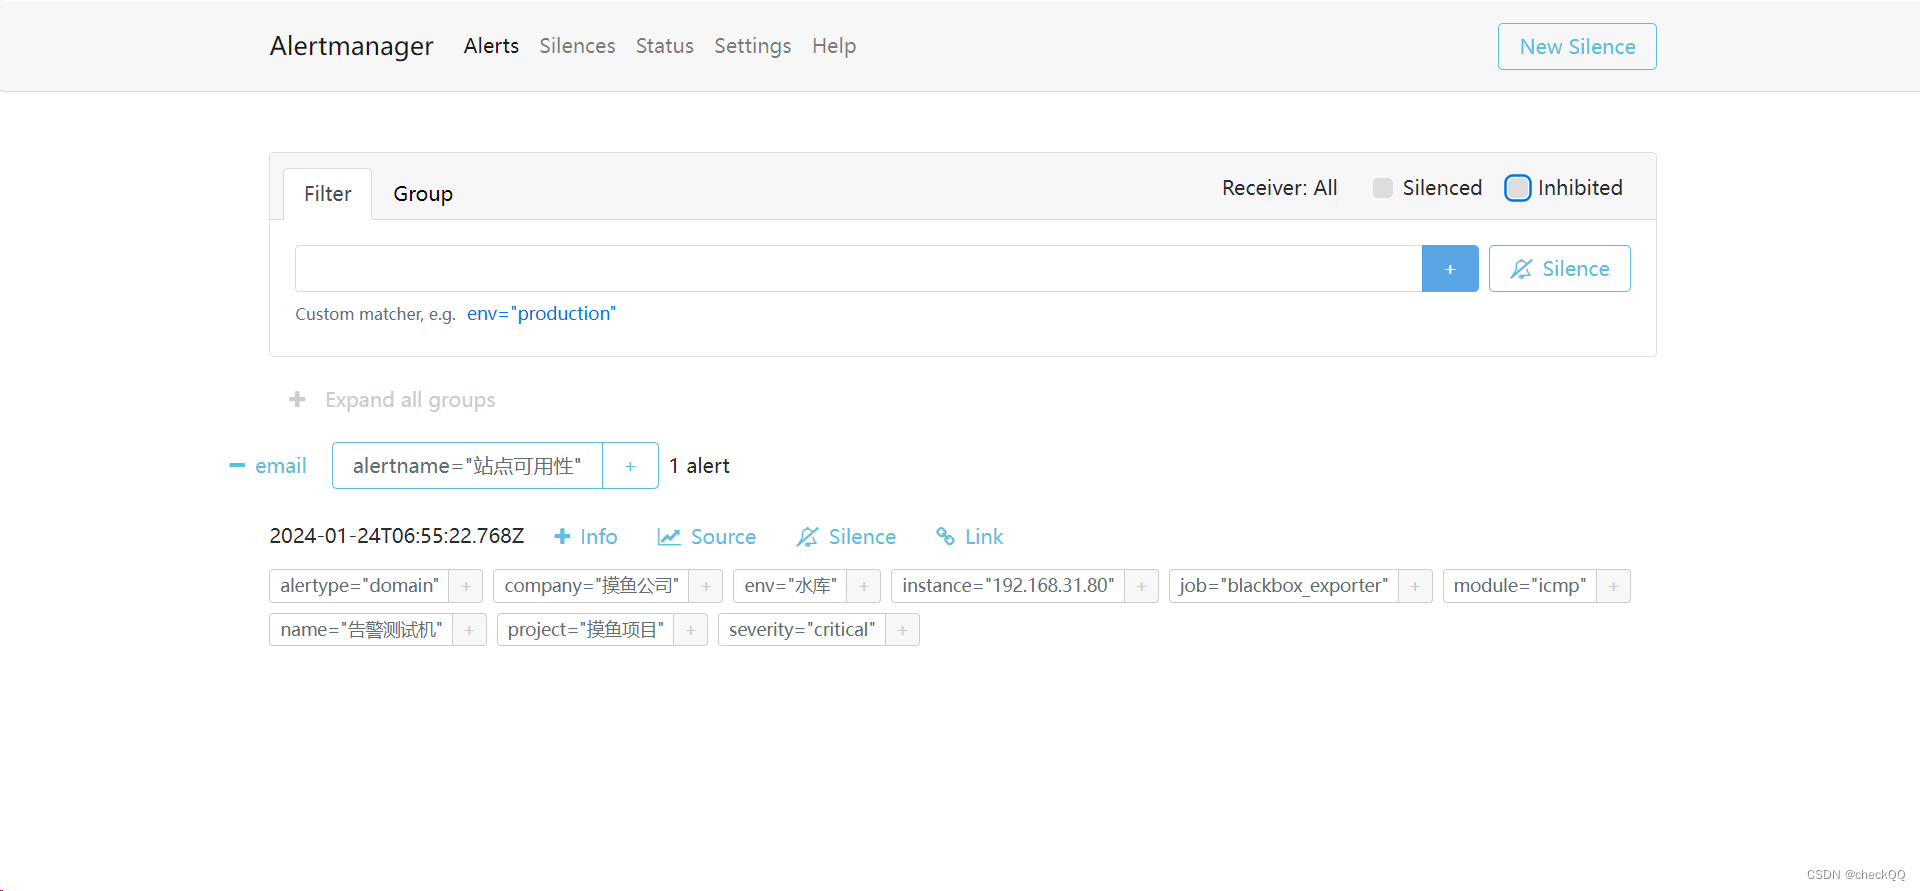
alertmanager查看被触发的告警信息
?登录邮箱查看告警邮件

本文来自互联网用户投稿,该文观点仅代表作者本人,不代表本站立场。本站仅提供信息存储空间服务,不拥有所有权,不承担相关法律责任。 如若内容造成侵权/违法违规/事实不符,请联系我的编程经验分享网邮箱:chenni525@qq.com进行投诉反馈,一经查实,立即删除!
- Python教程
- 深入理解 MySQL 中的 HAVING 关键字和聚合函数
- Qt之QChar编码(1)
- MyBatis入门基础篇
- 用Python脚本实现FFmpeg批量转换
- 我们是如何测试人工智能的(一)基础效果篇
- 【力扣209】长度最小的子数组【双指针+滑动窗口】Java代码讲解
- 2,PyCharm的下载与安装
- 深入理解JVM--第2章 Java内存区域与内存溢出异常
- 深度学习(Deep Learning) 简介
- sed常用简说
- 计算机网络 VLAN
- 解决IDEA上传Git 带有本地编译文件问题
- 【第37例】IPD体系进阶:Charter开发需要回答的6个关键问题
- 腾讯云2核2G4M云服务器值得买吗?