vue3使用AntV G6 (图可视化引擎)历程[一]
发布时间:2024年01月23日
前言:G6 是一个图可视化引擎。它提供了图的绘制、布局、分析、交互、动画等基础的图可视化能力。旨在让关系变得透明,简单。让用户获得关系数据的 Insight。
一、前期准备
官网地址:https://g6-next.antv.antgroup.com/manual/introduction
安装:
# 备注:目前最新版本是 4.x ,可以直接安装yarn add @antv/g6 或 npm install --save @antv/g6,如果指定最新版本,则如下安装
# 使用 npm 安装
npm install --save @antv/g6@5.0.0-beta.28

# 使用 yarn 安装
yarn add @antv/g6@5.0.0

# 本项目安装版本
 "@antv/g6": "^4.8.24",
引入:
import G6 from '@antv/g6'
二、基本树图绘制案例
1. 组件抽离【Topology.vue】
<template>
  <div :id="domId" class="w-full h-[95%]"></div>
</template>
<script setup lang="ts">
import { initData } from '@/common/constants/topologyData/initRender'
import G6 from '@antv/g6'
import { nextTick, onMounted } from 'vue'

const props = defineProps({
  domId: {
    type: String,
    default: 'container',
  },
})
const initRender = () => {
  const container = document.getElementById(props.domId)
  const width = container?.scrollWidth
  const height = container?.scrollHeight
  const graph = new G6.TreeGraph({
    container: props.domId,
    width,
    height,
    modes: {
      default: [
        {
          type: 'collapse-expand',
          onChange: function onChange(item, collapsed) {
            const data = item?.get('model')
            data.collapsed = collapsed
            return true
          },
        },
        'drag-canvas',
        'zoom-canvas',
      ],
    },
    defaultNode: {
      size: 26,
      anchorPoints: [
        [0, 0.5],
        [1, 0.5],
      ],
    },
    defaultEdge: {
      type: 'cubic-horizontal',
    },
    layout: {
      type: 'dendrogram',
      direction: 'LR', // H / V / LR / RL / TB / BT
      nodeSep: 30,
      rankSep: 100,
    },
  })

  graph.node(function (node) {
    return {
      label: node.id,
      labelCfg: {
        position: node.children && node.children.length > 0 ? 'left' : 'right',
        offset: 5,
      },
    }
  })

  graph.data(initData)
  graph.render()
  graph.fitView()

  if (typeof window !== 'undefined')
    window.onresize = () => {
      if (!graph || graph.get('destroyed')) return
      if (!container || !container.scrollWidth || !container.scrollHeight) return
      graph.changeSize(container.scrollWidth, container.scrollHeight)
    }
}
onMounted(() => {
  nextTick(() => {
    initRender()
  })
})
</script>
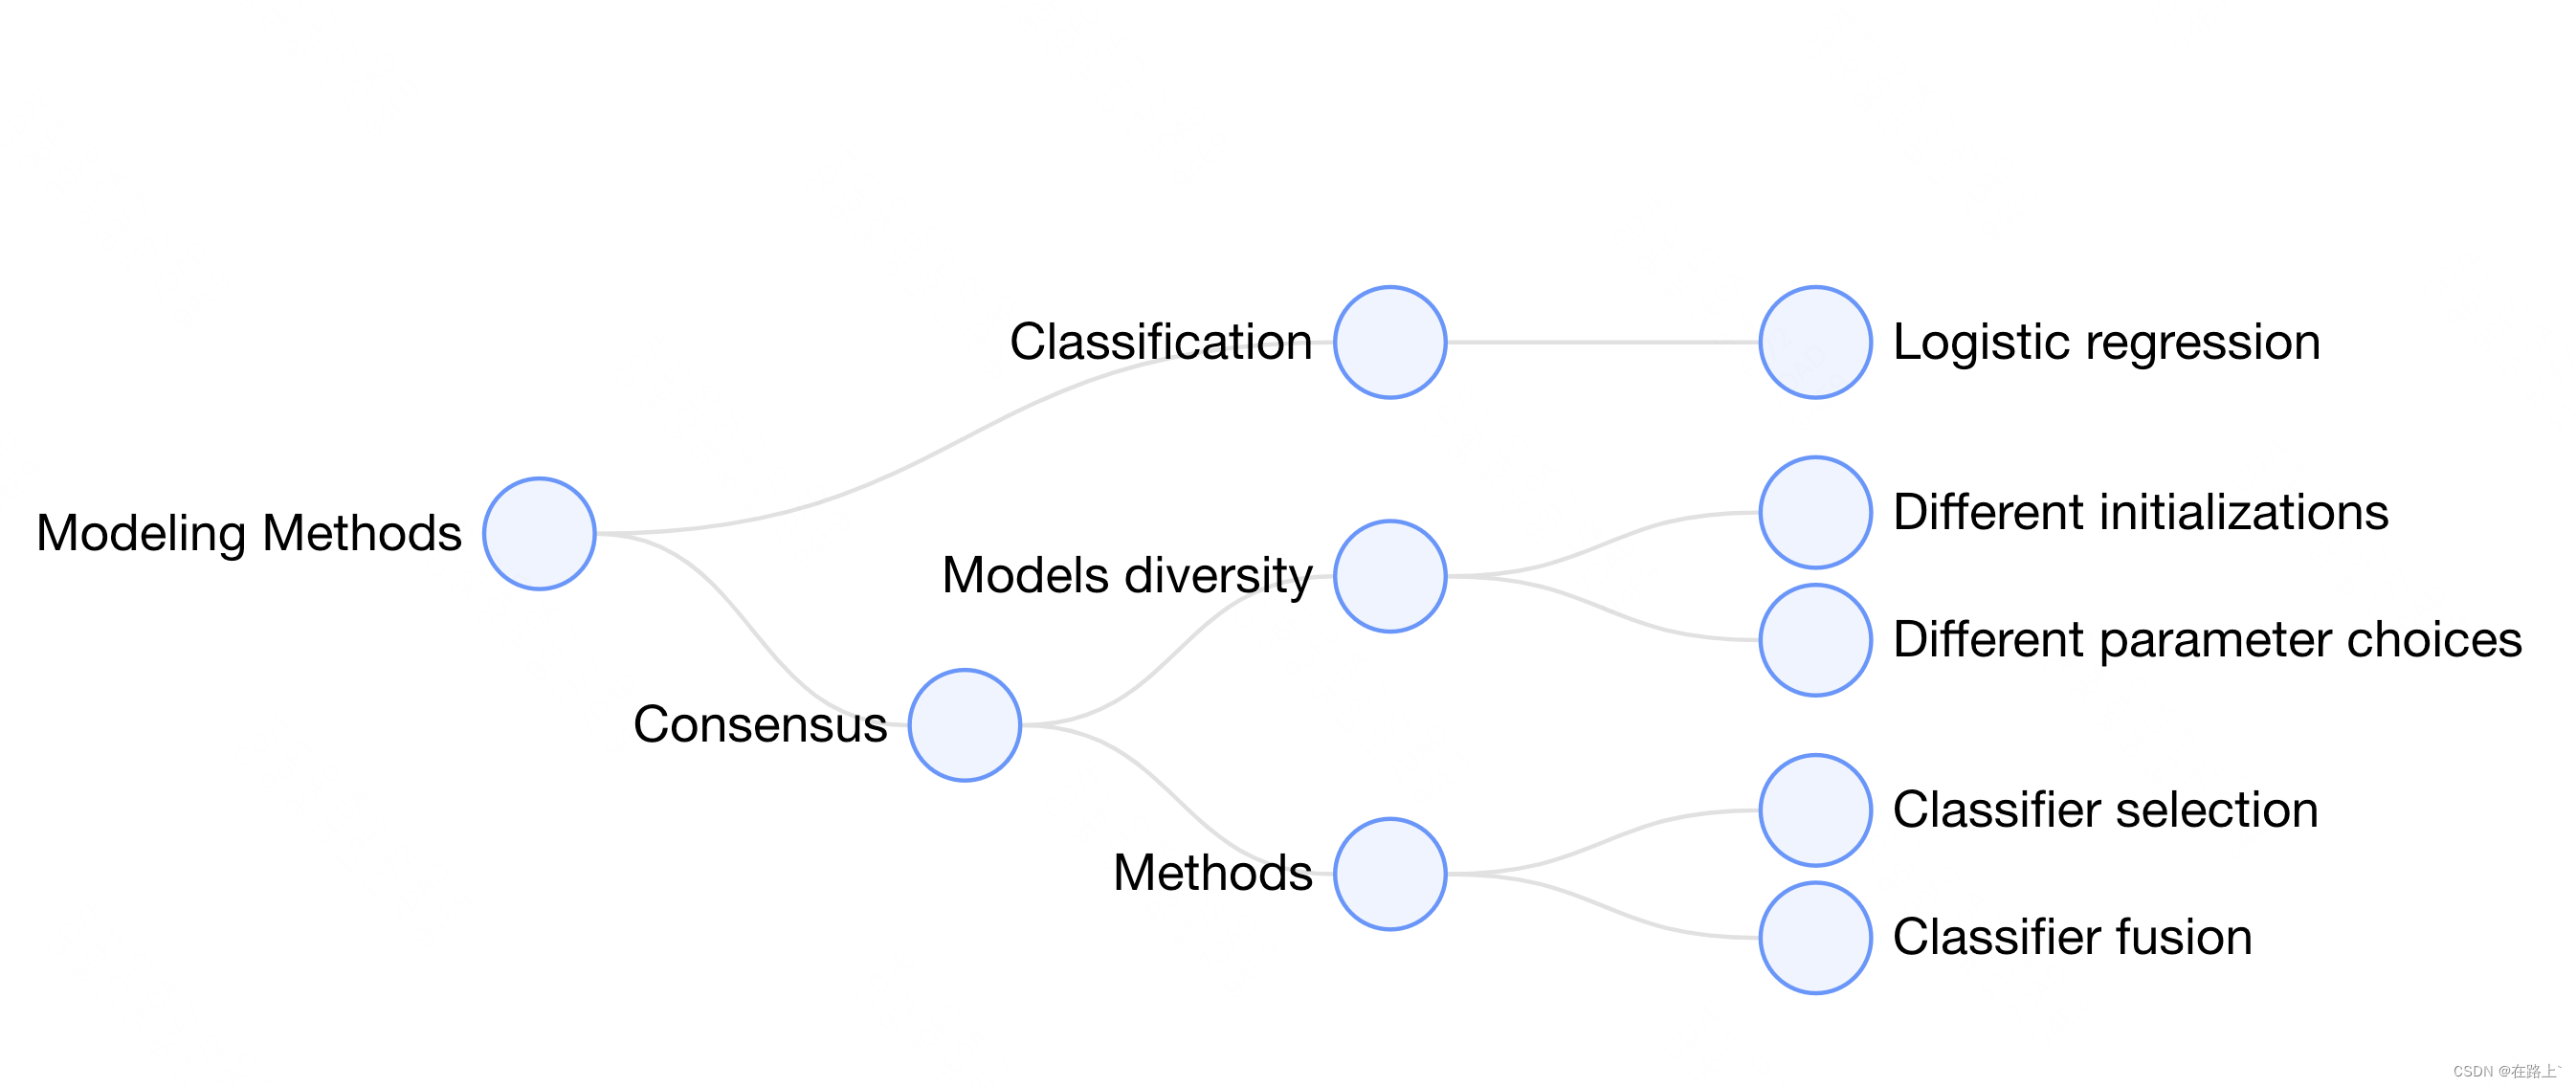
2. 数据格式
export const initData = {
  id: 'Modeling Methods',
  children: [
    {
      id: 'Classification',
      children: [
        {
          id: 'Logistic regression',
        },
      ],
    },
    {
      id: 'Consensus',
      children: [
        {
          id: 'Models diversity',
          children: [
            {
              id: 'Different initializations',
            },
            {
              id: 'Different parameter choices',
            },
          ],
        },
        {
          id: 'Methods',
          children: [
            {
              id: 'Classifier selection',
            },
            {
              id: 'Classifier fusion',
            },
          ],
        },
      ],
    },
  ],
}
3.组件调用
<TopologyBase domId="featureTreeInfoContainer" />
4.案例效果

三、绘制过程及官网案例
1.创建容器
需要在 HTML 中创建一个用于容纳 G6 绘制的图的容器,通常为 div 标签。G6 在绘制时会在该容器下追加 canvas 标签,然后将图绘制在其中。
// 挂载节点
<template>
  <div id="mountNode"></div>
</template>
2.数据准备
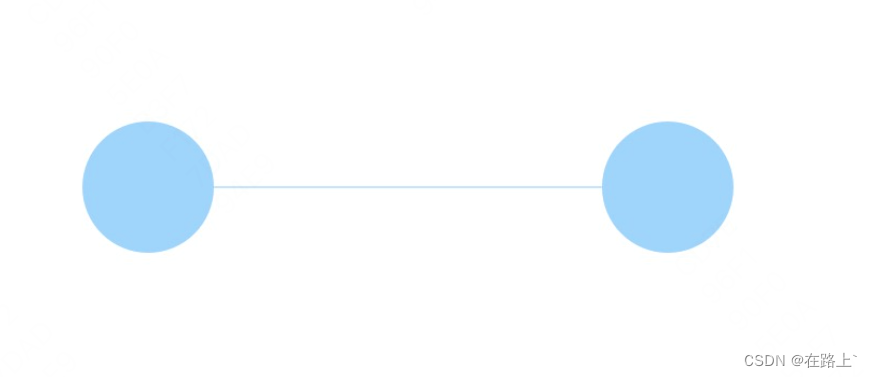
引入 G6 的数据源为 JSON 格式的对象。该对象中需要有节点(nodes)和边(edges)字段,分别用数组表示:
const data = {
  // 点集
  nodes: [
    {
      id: 'node1', // String,该节点存在则必须,节点的唯一标识
      x: 100, // Number,可选,节点位置的 x 值
      y: 200, // Number,可选,节点位置的 y 值
    },
    {
      id: 'node2', // String,该节点存在则必须,节点的唯一标识
      x: 300, // Number,可选,节点位置的 x 值
      y: 200, // Number,可选,节点位置的 y 值
    },
  ],
  // 边集
  edges: [
    {
      source: 'node1', // String,必须,起始点 id
      target: 'node2', // String,必须,目标点 id
    },
  ],
};
3.创建关系图
创建关系图(实例化)时,至少需要为图设置容器、宽和高。
const graph = new G6.Graph({
  container: 'mountNode', // String | HTMLElement,必须,在 Step 1 中创建的容器 id 或容器本身
  width: 800, // Number,必须,图的宽度
  height: 500, // Number,必须,图的高度
});
4.配置数据源,渲染
graph.data(data); // 读取 第2步 中的数据源到图上
graph.render(); // 渲染图
5. 最终结果

6. 完整代码
<!DOCTYPE html>
<html lang="en">
  <head>
    <meta charset="UTF-8" />
    <title>Tutorial Demo</title>
  </head>
  <body>
    /* 图的画布容器 */
    <div id="mountNode"></div>

    /* 引入 G6 */
    <script src="https://gw.alipayobjects.com/os/antv/pkg/_antv.g6-3.7.1/dist/g6.min.js"></script>

    <script>
      // 定义数据源
      const data = {
        // 点集
        nodes: [
          {
            id: 'node1',
            x: 100,
            y: 200,
          },
          {
            id: 'node2',
            x: 300,
            y: 200,
          },
        ],
        // 边集
        edges: [
          // 表示一条从 node1 节点连接到 node2 节点的边
          {
            source: 'node1',
            target: 'node2',
          },
        ],
      };

      // 创建 G6 图实例
      const graph = new G6.Graph({
        container: 'mountNode', // 指定图画布的容器 id,与第 9 行的容器对应
        // 画布宽高
        width: 800,
        height: 500,
      });
      // 读取数据
      graph.data(data);
      // 渲染图
      graph.render();
    </script>
  </body>
</html>
文章来源:https://blog.csdn.net/qq_39490750/article/details/135767947
本文来自互联网用户投稿,该文观点仅代表作者本人,不代表本站立场。本站仅提供信息存储空间服务,不拥有所有权,不承担相关法律责任。 如若内容造成侵权/违法违规/事实不符,请联系我的编程经验分享网邮箱:chenni525@qq.com进行投诉反馈,一经查实,立即删除!
本文来自互联网用户投稿,该文观点仅代表作者本人,不代表本站立场。本站仅提供信息存储空间服务,不拥有所有权,不承担相关法律责任。 如若内容造成侵权/违法违规/事实不符,请联系我的编程经验分享网邮箱:chenni525@qq.com进行投诉反馈,一经查实,立即删除!
最新文章