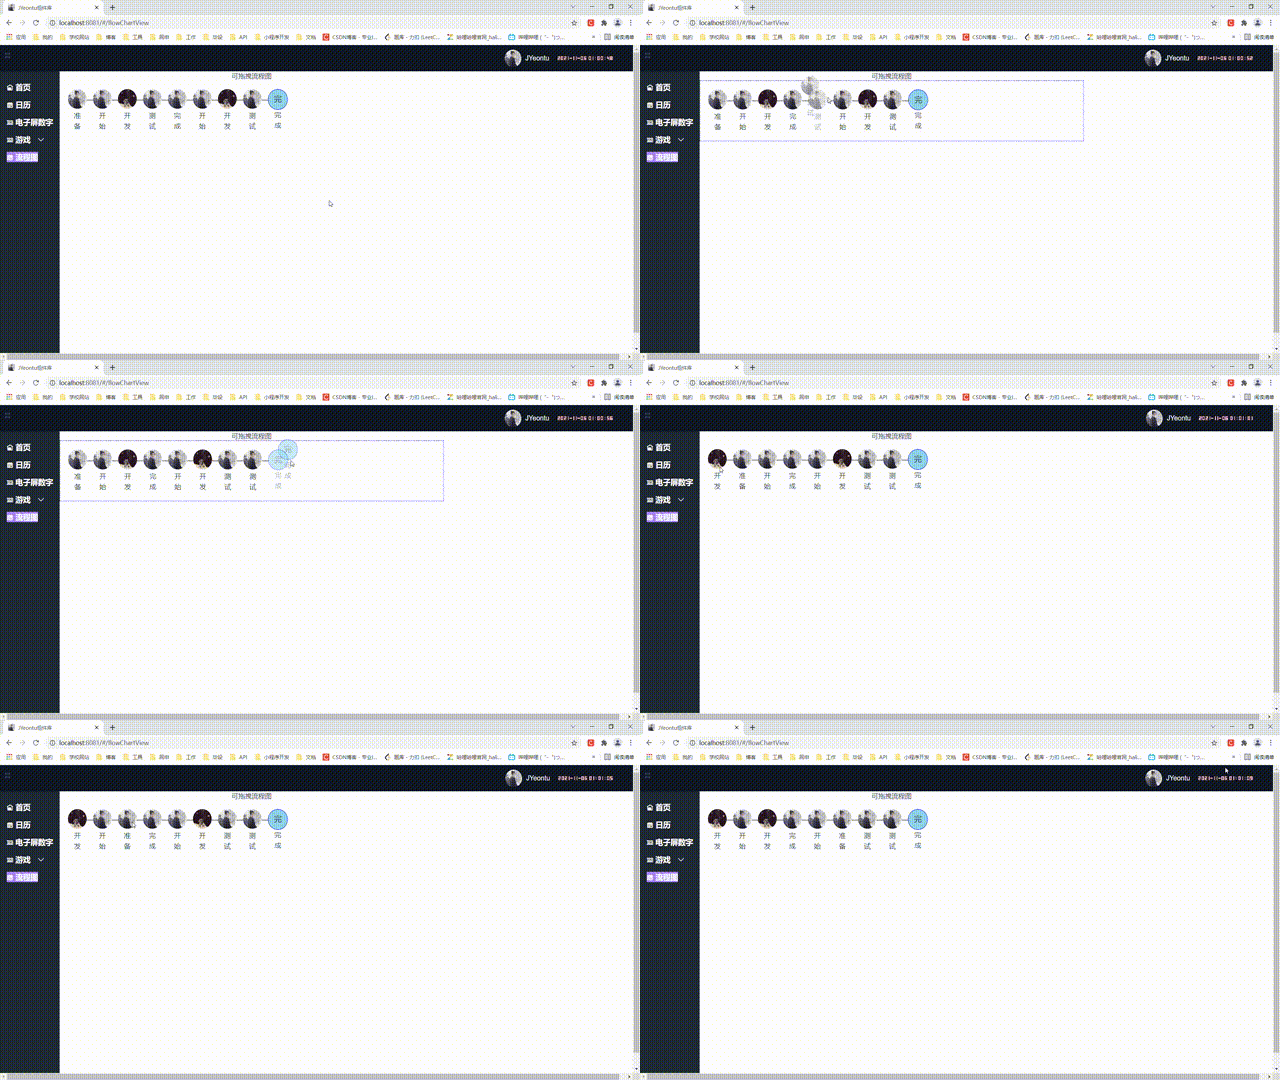
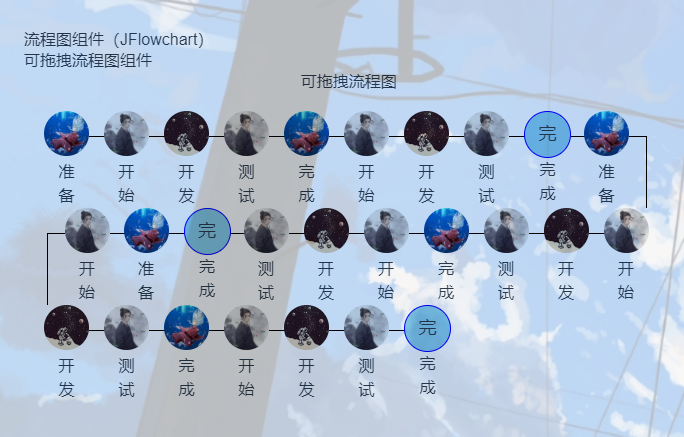
可拖拽流程图组件开发
效果


说在前面
流程图在技术领域是一种常见的可视化工具,用于展示系统、应用或业务流程的各个步骤以及它们之间的关系。它们可以帮助开发人员和项目团队更好地理解和规划复杂的流程,从而提高工作效率和准确性。但是,传统的静态流程图有时无法满足用户的需求,因此实现可拖拽的流程图组件成为了一个重要的需求。
实现可拖拽的流程图组件的目的和意义是为了提供一种交互性更强、用户体验更好的流程图展示方式。通过该组件,用户可以轻松地拖拽节点进行重新排序,自由调整流程图的结构和布局,从而更好地满足项目需求并提高工作效率。
组件设计
首先需要设计好配置参数,然后就是讲配置参数融入到样式的设计处理上,最后是实现组件拖动并实时展示效果。
参数
整体参数
| 参数 | 描述 |
|---|---|
| title | 标题(String) |
| dragAble | 是否可拖拽(Boolean) |
| width | 图标最小宽度(number) |
| radius | 是否圆角(Boolean) |
| data | 流程项(Array) |
data流程项参数
结构如下
[
	{
		icon:require('@/assets/logo.png'),//图标
		text:'准备'//文字
	},
	{
		icon:require('@/assets/1.png'),
		text:'开始'
	},
]
功能
拖拽事件监听
通过监听鼠标的按下、移动和抬起等事件,实现节点的拖拽功能。
if (this.chartData.dragAble) {
    document
        .getElementById("flow-chart")
        .addEventListener("mouseup", this.handleMouseup);
    document
        .getElementById("flow-chart")
        .addEventListener("mouseover", this.handleMouseover);
    document
        .getElementById("flow-chart")
        .addEventListener("touchend", this.handleMouseup);
    document
        .getElementById("flow-chart")
        .addEventListener("touchmove", this.handleMouseover);
}
阻止默认事件
为了确保拖拽功能正常运作,需要在拖拽过程中阻止浏览器默认的拖拽行为。
//阻止默认事件
preventEvent() {
    document.getElementById("flow-chart").ondragstart = function () {
        return false;
    };
    document.getElementById("flow-chart").onselectstart = function () {
        return false;
    };
},
初始化样式和数据
在组件加载时,需要初始化节点的样式和位置,以及计算每个节点的宽度和每行显示的数量。
//初始化样式变量
initStyle() {
    let chartContent = this.$refs.chartContent;
    let width = chartContent.offsetWidth - 40;
    let itemWidth = Math.max(20, Math.floor(width / 7));
    if (this.chartData.width) {
        itemWidth = this.chartData.width;
    }
    this.itemWidth = itemWidth;
    this.itemNum = Math.floor(width / (itemWidth + itemWidth / 5));
},
//初始化数据
initData() {
    let data = this.vChartDataList;
    let res = [],
        flag = true,
        temp = [];
    for (let i = 1; i <= data.length; i++) {
        data[i - 1].id = "item" + "-" + res.length + "-" + (i - 1);
        if (flag) temp.push(data[i - 1]);
        else temp.unshift(data[i - 1]);
        if (i % this.itemNum == 0 || i == data.length) {
            res.push([...temp]);
            temp = [];
            flag = !flag;
        }
    }
    this.chartDataList = res;
},
//重组class
getClass(res, str) {
    if (this.chartData[str]) res += " " + str;
    return res;
},
//重组行样式
getColumnStyle(index) {
    let res = {};
    if (index < this.chartDataList.lenth - 1 || index % 2 == 0)
        return this.styleConcat(res);
    res["margin-left"] = "auto";
    res["margin-right"] = -this.itemWidth / 5 + "px;";
    return this.styleConcat(res);
},
//重组每个item的样式
getItemStyle(item = "") {
    let res = {};
    if (item != "") {
        if (item.opacity) {
            res.opacity = item.opacity;
        }
        return this.styleConcat(res);
    }
    res.width = this.itemWidth + "px;";
    res["margin-right"] = this.itemWidth / 5 + "px;";
    return this.styleConcat(res);
},
//重组每个item的icon的样式
getIconStyle(str) {
    let res = {};
    res.width = this.itemWidth - 5 + "px;";
    res.height = this.itemWidth - 5 + "px";
    if (str == "text") {
        res["line-height"] = this.itemWidth - 5 + "px";
        res["font-size"] = "large";
        res["border"] = "1px solid blue";
        res["background-color"] = "skyblue";
    }
    return this.styleConcat(res);
},
//获取连接线样式
getLineStyle(index, index1, flag) {
    if (
        index1 == this.chartDataList.length - 1 &&
        index == this.chartDataList[index1].length - 1
    )
        return "";
    let res = {};
    res["border-top"] = "1px solid black";
    res.width = this.itemWidth / 3 + "px";
    if (flag == "right")
        res["margin-right"] = -this.itemWidth / 3 + "px;";
    else {
        res["margin-left"] = -this.itemWidth / 3 + "px;";
        res["border-left"] = "1px solid black";
    }
    res["margin-top"] = this.itemWidth / 2 + "px;";
    if (
        index == this.chartDataList[0].length - 1 &&
        index1 < this.chartDataList.length - 1
    ) {
        if (index1 % 2 == 0) {
            res["border-right"] = "1px solid black";
        }
    }
    if (index1 % 2 == 1) {
        if (index == this.chartDataList[index1].length - 1) return "";
    }
    return this.styleConcat(res);
},
//json变量转换为style字符串
styleConcat(obj) {
    let res = "";
    for (let k in obj) {
        res += k + ":" + obj[k] + ";";
    }
    return res;
},
处理鼠标抬起事件
当鼠标抬起时,将拖拽的节点插入到新的位置,并更新节点的样式和位置。
//鼠标抬起时
handleMouseup(event) {
    const chartContent = document.getElementById("chartContent");
    if (this.vChartDataList[this.oldInd])
        this.vChartDataList[this.oldInd].opacity = 1;
    chartContent.style.border = "none";
    this.operateDom = null;
    this.operateDomNum = null;
    this.oldInd = null;
},
处理鼠标移动事件
在拖拽过程中,根据鼠标的位置计算节点的新样式和位置,实现拖拽时的效果。
handleMouseover(event) {
    if (this.vChartDataList.length < this.chartData.data.length) {
        this.vChartDataList.unshift({ ...this.chartData.data[0] });
    }
    if (this.operateDom != null) {
        const w = this.operateDom.offsetWidth,
            h = this.operateDom.offsetHeight;
        let x = event.pageX,
            y = event.pageY;
        this.operateDom.style.position = "fixed";
        this.operateDom.style.opacity = "0.5";
        this.operateDom.style.left = x - w / 2 - window.scrollX + "px";
        this.operateDom.style.top = y - h / 2 - window.scrollY + "px";
        let { tx, ty } = this.getItemCoords(x, y);
        let oldInd = this.oldInd;
        if (oldInd >= 0) {
            this.vChartDataList.splice(oldInd, 1);
            this.initData();
        }
        let nty =
            parseInt(ty) % 2 == 0
                ? parseInt(tx)
                : this.itemNum - parseInt(tx);
        nty = Math.min(nty, this.itemNum);
        nty = Math.max(nty, 0);
        oldInd = parseInt(ty) * this.itemNum + nty;
        oldInd = Math.min(this.chartData.data.length - 1, oldInd);
        oldInd = Math.max(0, oldInd);
        this.oldInd = oldInd;
        if (oldInd < 0) return;
        this.vChartDataList.splice(oldInd, 0, { ...this.selectedItem });
        this.initData();
    }
},
//获取当前移动到的坐标
getItemCoords(x, y) {
    let d = document.getElementById("chartContent");
    let left = d.offsetLeft;
    let top = d.offsetTop;
    (x = x - left), (y = y - top);
    let itemNum = this.itemNum;
    let w = d.offsetWidth;
    let h = d.offsetHeight;
    let moveDiv = document.getElementById("moveDiv");
    let th = moveDiv.offsetHeight;
    w = Math.ceil(w / itemNum);
    (x = Math.floor(x / w)), (y = Math.floor(y / th));
    return { tx: x, ty: y };
},
源码
Gitee地址:https://gitee.com/zheng_yongtao/jyeontu-component-warehouse
预览地址
组件文档:http://jyeontu.xyz/jvuewheel/#/flowChartView
公众号
关注公众号『前端也能这么有趣』,获取更多有趣内容。
说在后面
🎉 这里是 JYeontu,现在是一名前端工程师,有空会刷刷算法题,平时喜欢打羽毛球 🏸 ,平时也喜欢写些东西,既为自己记录 📋,也希望可以对大家有那么一丢丢的帮助,写的不好望多多谅解 🙇,写错的地方望指出,定会认真改进 😊,偶尔也会在自己的公众号『
前端也能这么有趣』发一些比较有趣的文章,有兴趣的也可以关注下。在此谢谢大家的支持,我们下文再见 🙌。
本文来自互联网用户投稿,该文观点仅代表作者本人,不代表本站立场。本站仅提供信息存储空间服务,不拥有所有权,不承担相关法律责任。 如若内容造成侵权/违法违规/事实不符,请联系我的编程经验分享网邮箱:chenni525@qq.com进行投诉反馈,一经查实,立即删除!
- Python教程
- 深入理解 MySQL 中的 HAVING 关键字和聚合函数
- Qt之QChar编码(1)
- MyBatis入门基础篇
- 用Python脚本实现FFmpeg批量转换
- 易安联参与制定的《面向云计算的零信任体系》行业标准即将实施
- Java的Base64加密解密详解
- habitat challenge rearrangement代码复现细节及踩坑实录
- 基于微信支付的体育场馆预订小程序开发笔记一
- JVM工作原理与实战(二十三):堆的垃圾回收-引用计数法和可达性分析法
- 关于std 线程库 优先级问题 以及linux 线程优先级设置不生效问题记录
- WizFi360-EVB-Pico评估版介绍
- 【计算机图形学】《五讲速通CG重点》第二讲-Viewing
- FAST OS DOCKER 可视化Docker管理工具
- PHP Tools for Visual Studio 2023 Crack